Data warehouse dimensional modeling
- Warehouse dimensional modeling is a data modeling technique used to store and organize data in a data warehouse. It is a way of organizing data so that it is easy to query and analyze.
- It's particularly valuable when dealing with large datasets and complex business questions.
- Warehouse dimensional modeling is a powerful technique for storing and organizing data in a data warehouse. It makes it easy to query and analyze data, and it can be used to support a wide range of business intelligence and data warehousing applications.
- Warehouse dimensional modeling is based on the concept of dimensions and facts.
- Dimensions These are attributes by which you want to analyze your data. Common dimensions include time, geography,
product, customer, and more, depending on the domain.
- Dimensions often have hierarchies. For example, a time dimension might have a hierarchy of Year > Quarter > Month > Day. Hierarchies enable drill-down analysis.
- Facts are quantitative measurements of data, such as sales, inventory, and website traffic.
- Dimensions These are attributes by which you want to analyze your data. Common dimensions include time, geography,
product, customer, and more, depending on the domain.
Objectives of Dimensional Modeling
The purposes of dimensional modeling are:
- To produce database architecture that is easy for end-clients to understand and write queries.
- To maximize the efficiency of queries. It achieves these goals by minimizing the number of tables and relationships between them.
Types of tables in dimensional modeling
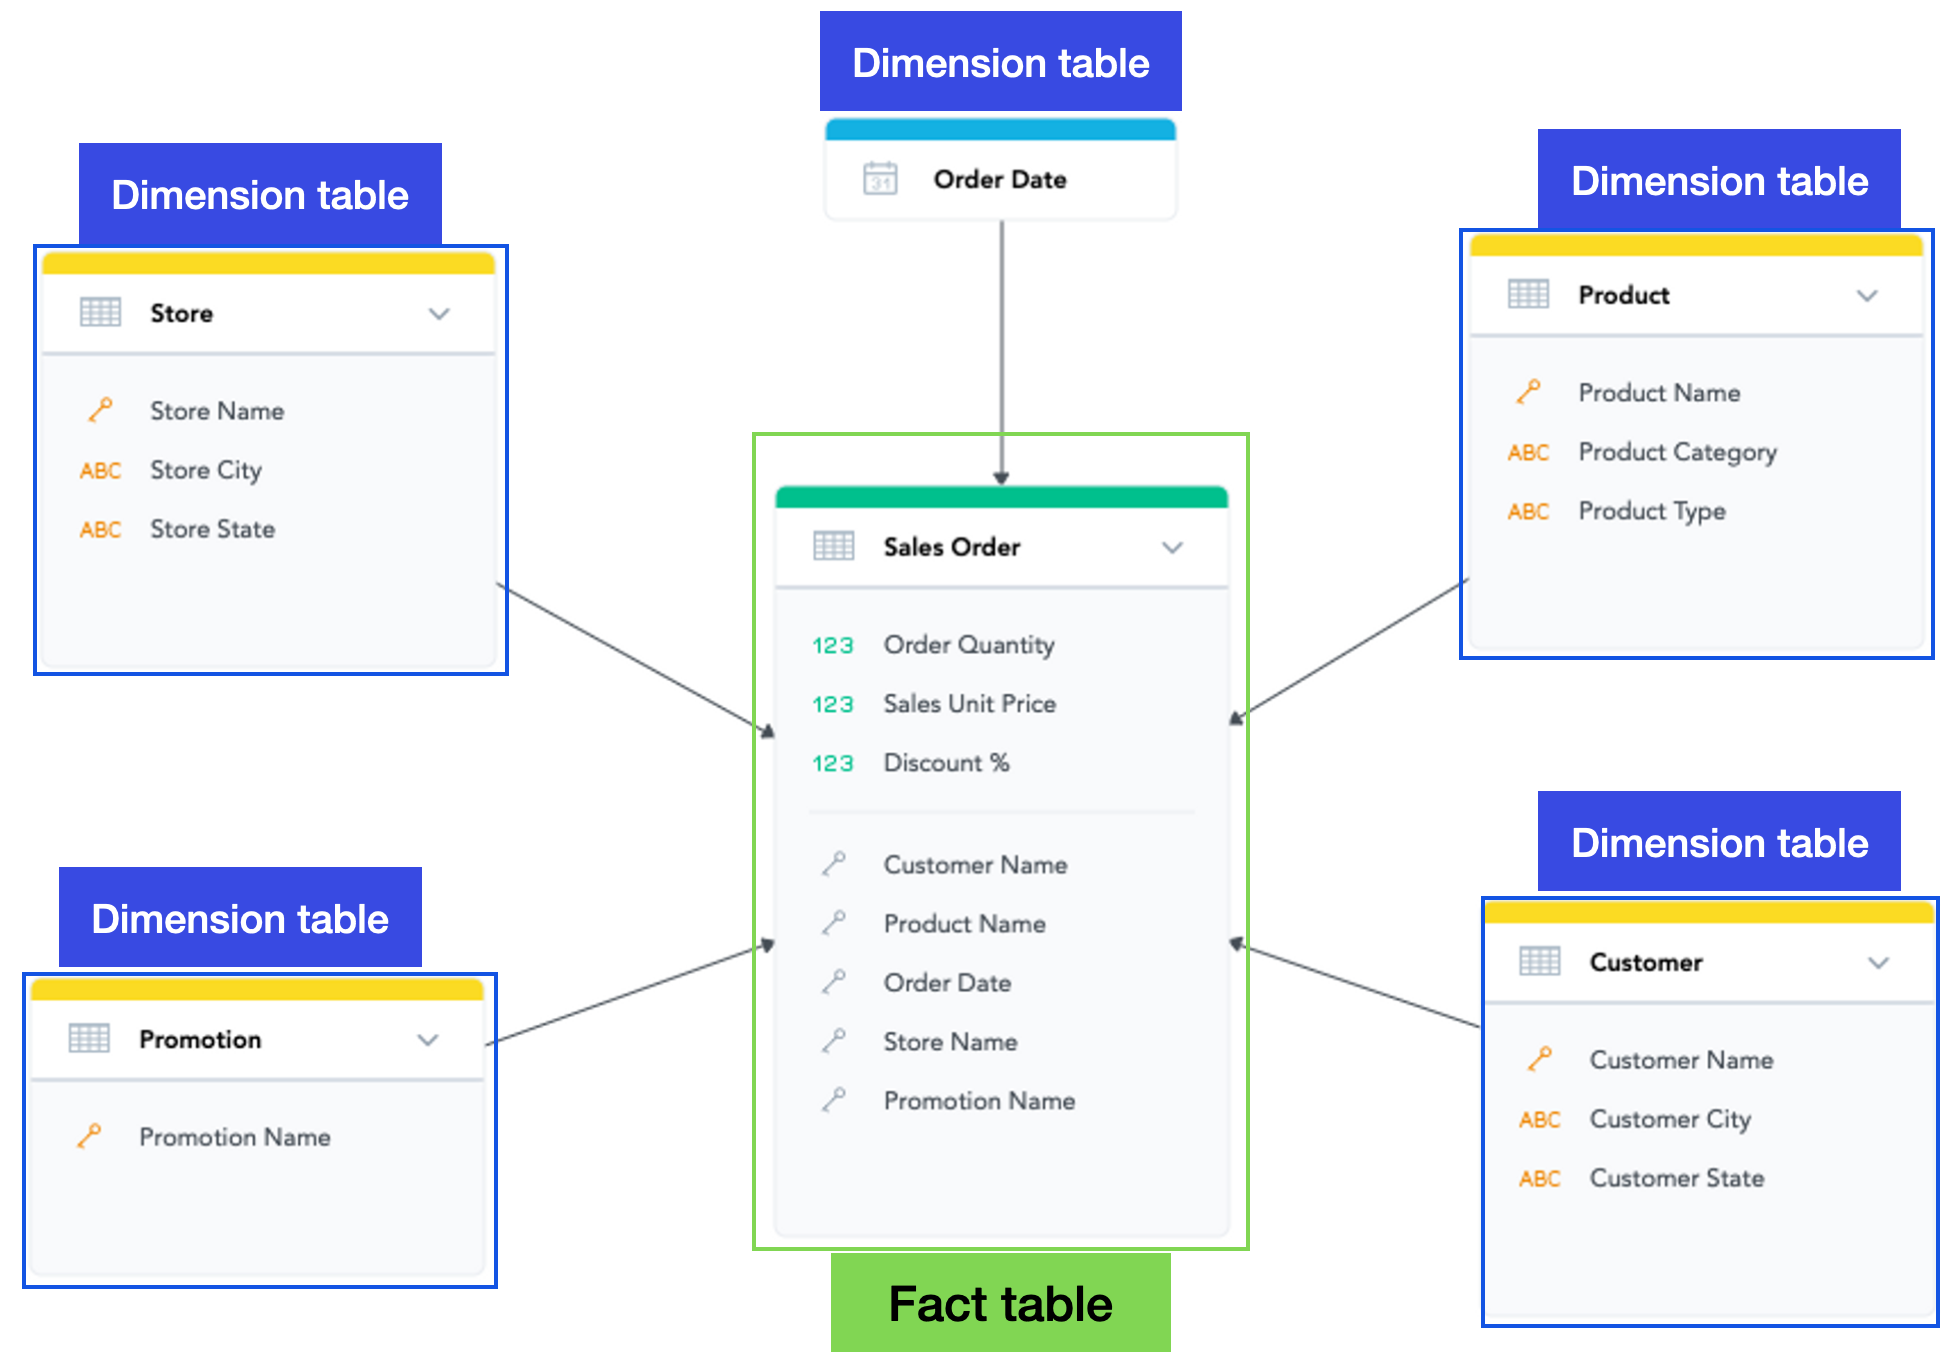
In a warehouse dimensional model, data is stored in two types of tables:
- Dimension tables:
- Each dimension table contains attributes related to that dimension. For example, a "Time" dimension might have attributes like Year, Quarter, Month, and Day.
- Dimension tables are typically normalized, which means that they are organized in such a way that each attribute is only stored once.
- Fact tables:
- These are measurable data points or metrics you want to analyze, such as sales revenue, quantity sold, or profit.
- foreign keys: Fact tables typically contain foreign keys that link to dimension tables. These foreign keys establish relationships between dimensions and facts.
- Contrary to dimension table, fact tables, are typically denormalized, which means that they may contain redundant data. This is done to improve query performance.
Dimension tables contain data about the dimensions, and fact tables contain data about the facts.
Advantages of Dimensional Modeling
Here are some of the benefits of using warehouse dimensional modeling:
- Improved query performance: Warehouse dimensional models are designed for fast querying and analysis. This is because dimension tables are normalized and fact tables are denormalized.
- Reduced data redundancy: Warehouse dimensional models can help to reduce data redundancy by storing data in a single location. This can save storage space and improve data quality.
- Improved data consistency: Warehouse dimensional models can help to improve data consistency by enforcing referential integrity constraints between dimension tables and fact tables. This ensures that data is always accurate and up-to-date.
- Improved data accessibility: Warehouse dimensional models make it easy to access data from different sources. This is because dimension tables and fact tables are typically stored in a single database.
Warehouse dimensional modeling is a valuable technique for any organization that needs to store and analyze large amounts of data. It can help organizations to improve their business intelligence and data warehousing capabilities.
Disadvantages of Dimensional Modeling
- To maintain the integrity of fact and dimensions, loading the data warehouses with a record from various operational systems is complicated.
- It is severe to modify the data warehouse operation if the organization adopting the dimensional technique changes the method in which it does business.
Example
Here are some examples of how warehouse dimensional modeling is used in the real world:
- Retail: Retailers use warehouse dimensional modeling to analyze customer data, product data, and sales data. This data can be used to improve customer targeting, product recommendations, and inventory management.
- Finance: Financial institutions use warehouse dimensional modeling to analyze customer data, transaction data, and market data. This data can be used to improve risk management, fraud detection, and investment decisions.
- Healthcare: Healthcare organizations use warehouse dimensional modeling to analyze patient data, medical research data, and clinical trial data. This data can be used to improve patient care, develop new treatments, and reduce costs.
Warehouse dimensional modeling is a powerful technique that can be used to support a wide range of business applications.

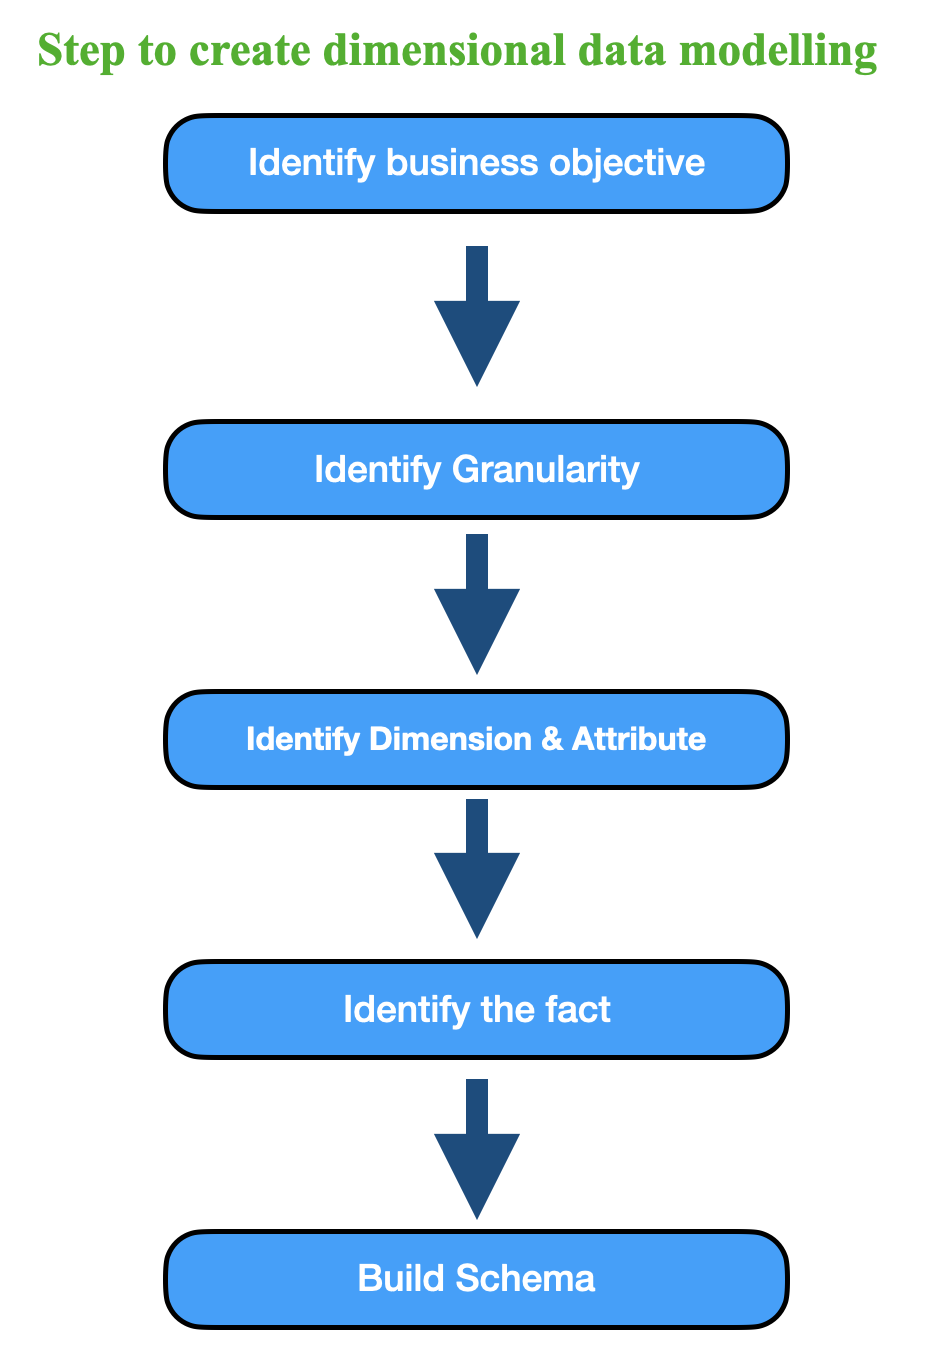
Steps to creat a dimensional data model
Dimensional data modeling is a key technique in data warehousing and analytics. Here are the basic steps to create a dimensional data model:
- Identify Business Requirements: Begin by understanding the business needs and the questions you want to answer with your data model. This step is crucial as it guides the entire modeling process.
- Select Dimension and Fact Tables: Identify the entities (dimensions) and the measurable data (facts) that are relevant to your analysis. Dimensions are attributes by which you want to analyze your data, while facts are the numerical data points you want to measure.
- Design Dimension Tables:
- Create dimension tables for each dimension identified in step 2. These tables contain attributes related to each dimension. For example, if you are modeling sales data, you might have a "Time" dimension with attributes like Year, Quarter, Month, etc.
- Define hierarchies within dimensions, such as Year > Quarter > Month in the Time dimension.
- Design Fact Tables:
- Create fact tables that store the measures or metrics you want to analyze. These tables typically contain foreign keys to link to dimension tables.
- Decide on the granularity of your fact table. This determines the level of detail at which data is recorded. For example, daily sales or monthly sales.
- Establish Relationships: Define the relationships between dimension tables and fact tables using foreign keys. This linkage allows you to perform meaningful queries across different dimensions.
- Create a Star or Snowflake Schema:
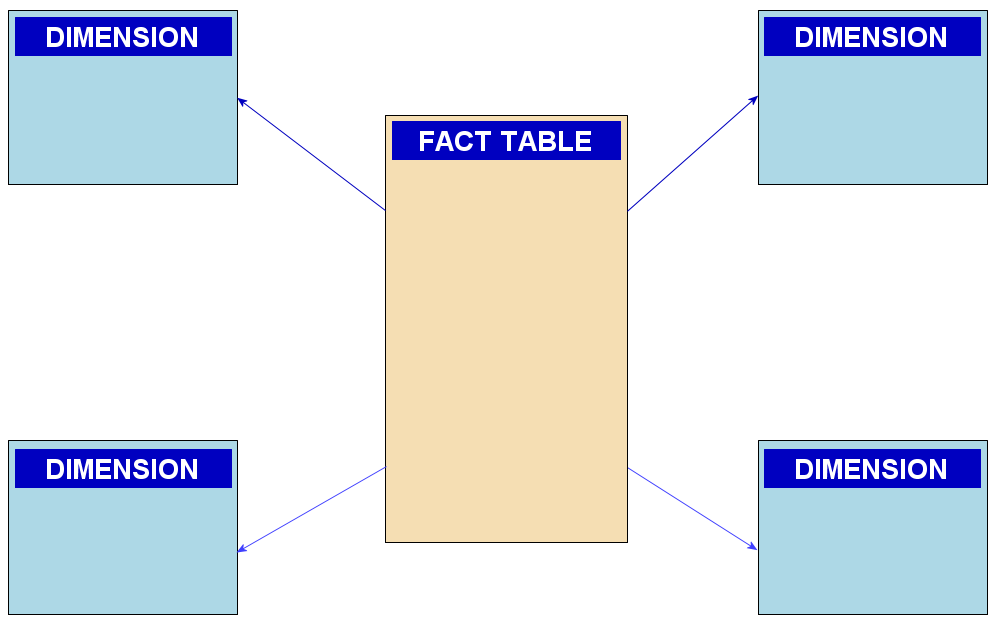
- In a star schema, all dimension tables directly relate to the fact table. It's a simple and denormalized structure.
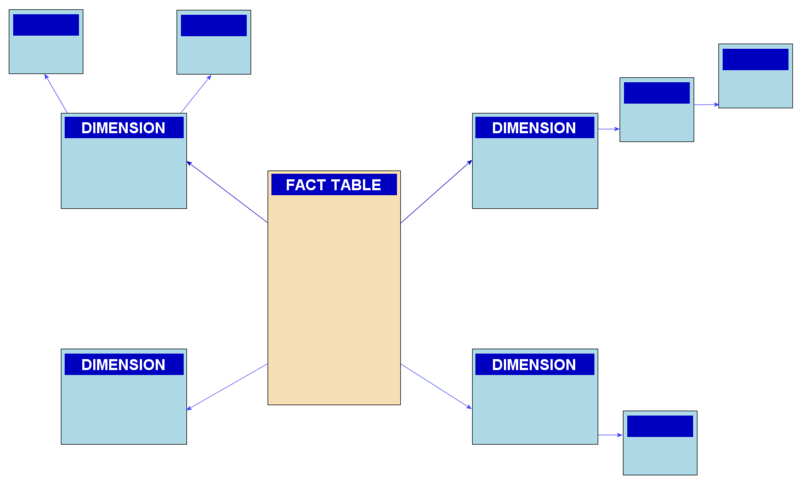
- In a snowflake schema, dimension tables may be normalized, leading to a more complex but space-efficient structure.
- Populate Data: Load data into your dimension and fact tables from various sources, such as databases or external files. Ensure data quality and consistency.
- Add Hierarchies and Aggregations:
- Create hierarchies in your dimension tables to facilitate drill-down analysis.
- Pre-calculate aggregations like sums, averages, or counts in your fact table to improve query performance.
- Implement Business Logic: Apply any required business rules or calculations to the data to meet specific analytical needs.
- Testing and Validation: Thoroughly test your data model by running sample queries and ensuring the results match the expected outcomes.
- Documentation: Document the structure of your dimensional data model, including definitions of dimensions, facts, hierarchies, and relationships. This documentation is crucial for future users.
Optimization: Continuously monitor and optimize the performance of your data model as the data volume grows or business requirements change.
- Usage and Reporting: Finally, make the data model available to end-users through data visualization tools or analytics platforms for reporting and analysis.
Remember that dimensional modeling is highly dependent on the specific business context and data you're working with. Tailor your approach to meet the unique requirements of your projects, whether they are related to data science, data analytics, finance, or data engineering.
Main steps for dimensional modelling can be summarized as:

Ways to structure data warehouse
There are several ways to structure a data warehouse, depending on the specific needs and requirements of the organization. Here are some common approaches to structuring a data warehouse:
- Star Schema: The star schema is a widely used structure in data warehousing. It consists of a central fact table surrounded by multiple dimension tables. The fact table contains the measurements or facts of the business, such as sales or revenue, and the dimension tables provide context to these facts. Each dimension table represents a different aspect of the business, such as time, product, customer, or location. The star schema offers simplicity, ease of understanding, and efficient query performance.
- Snowflake Schema: The snowflake schema is an extension of the star schema. It expands on the dimension tables by normalizing them into multiple levels. In a snowflake schema, dimension tables are connected through hierarchical relationships, resulting in a more complex structure. This schema can be useful when dealing with dimensions that have many attributes and hierarchies. However, it may require more complex query joins and can potentially impact performance.
- Fact Constellation (Galaxy) Schema: The fact constellation schema, also known as the galaxy schema, is a more complex structure that consists of multiple fact tables sharing dimension tables. It is suitable when there are multiple fact tables representing different business processes or areas, but they share common dimensions. The fact constellation schema offers greater flexibility and can support complex analysis involving multiple fact tables.
- Data Vault: The Data Vault methodology is a modeling technique that focuses on scalability, flexibility, and historical tracking of data. It involves separating the data into three main types of tables: the hub tables representing core business entities, the satellite tables containing descriptive information about the hubs, and the link tables that capture the relationships between hubs. Data Vault structures are designed to handle large volumes of data, accommodate changes over time, and provide traceability of data.
- Hybrid Approaches: In practice, many data warehouses use a combination of different structures to meet specific needs. This can involve a mix of star schemas, snowflake schemas, and other modeling techniques. Hybrid approaches allow organizations to strike a balance between simplicity, performance, and flexibility by adopting different structures based on the specific requirements of different parts of the data warehouse.

(Image credit: https://en.wikipedia.org/wiki/Snowflake_schema)

(Image credit: https://en.wikipedia.org/wiki/Snowflake_schema)

(Image credit: https://www.geeksforgeeks.org/fact-constellation-in-data-warehouse-modelling/)

(Image credit: https://blog.viadee.de/data-vault-nutzen-und-funktionsweise)
The choice of data warehouse structure depends on factors such as the complexity of the data, the analytical requirements, the organization's reporting needs, and the scalability and performance considerations. It's important to carefully analyze the data and business requirements before determining the appropriate structure for a data warehouse.
Natural and surrogate keys
Natural keys and surrogate keys are two different types of primary keys used in database design to uniquely identify records in a table. They serve similar purposes but are based on different principles.
1. Natural Key:
- A natural key is a primary key that is derived from the actual data attributes of the record, typically a meaningful and unique piece of data.
- Natural keys are based on real-world data that is inherent to the entity being represented in the table.
For example, in an "Employee" table, the employee's Social Security Number (SSN) or Employee ID could be used as a natural key if they are unique for each employee.
Pros of Natural Keys:
- They are meaningful and can provide context to the data.
No need to introduce an additional identifier.
Cons of Natural Keys:
- They can change over time (e.g., employee name changes), which can be problematic for historical data.
- They may not be suitable for all situations, such as when data lacks a clear natural key.
2. Surrogate Key:
- A surrogate key is an artificial primary key created specifically for the purpose of uniquely identifying records in a table.
- Surrogate keys have no inherent meaning and are typically implemented as auto-incremented integers or GUIDs (Globally Unique Identifiers).
They are not related to any natural data attributes of the entity.
Pros of Surrogate Keys:
- They are stable and do not change, making them ideal for historical data or situations where natural keys are subject to change.
- They provide better performance for indexing and joining tables because they are typically smaller and faster to compare than complex natural keys.
They eliminate the need to rely on potentially sensitive or confidential data (e.g., SSN) as the primary identifier.
Cons of Surrogate Keys:
- They lack inherent meaning and context, which can make data less intuitive to understand.
- In some cases, they may require an additional lookup to retrieve related real-world information.
In practice, the choice between natural keys and surrogate keys depends on the specific requirements of the database design and the nature of the data being stored. Many databases use a combination of both, where a surrogate key is used as the primary key for internal database operations, while a natural key is retained for external reference and reporting purposes. This hybrid approach combines the advantages of both types of keys.
Some other interesting things to know:
- Visit Data warehouse dimension modeling
- Visit the Data mining tutorial
- Visit my repository on GitHub for Bigdata, Databases, DBMS, Data modling, Data mining.
- Visit my website on SQL.
- Visit my website on PostgreSQL.
- Visit my website on Slowly changing variables.
- Visit my website on SNowflake.
- Visit my website on SQL project in postgresql.
- Visit my website on Snowflake data streaming.
