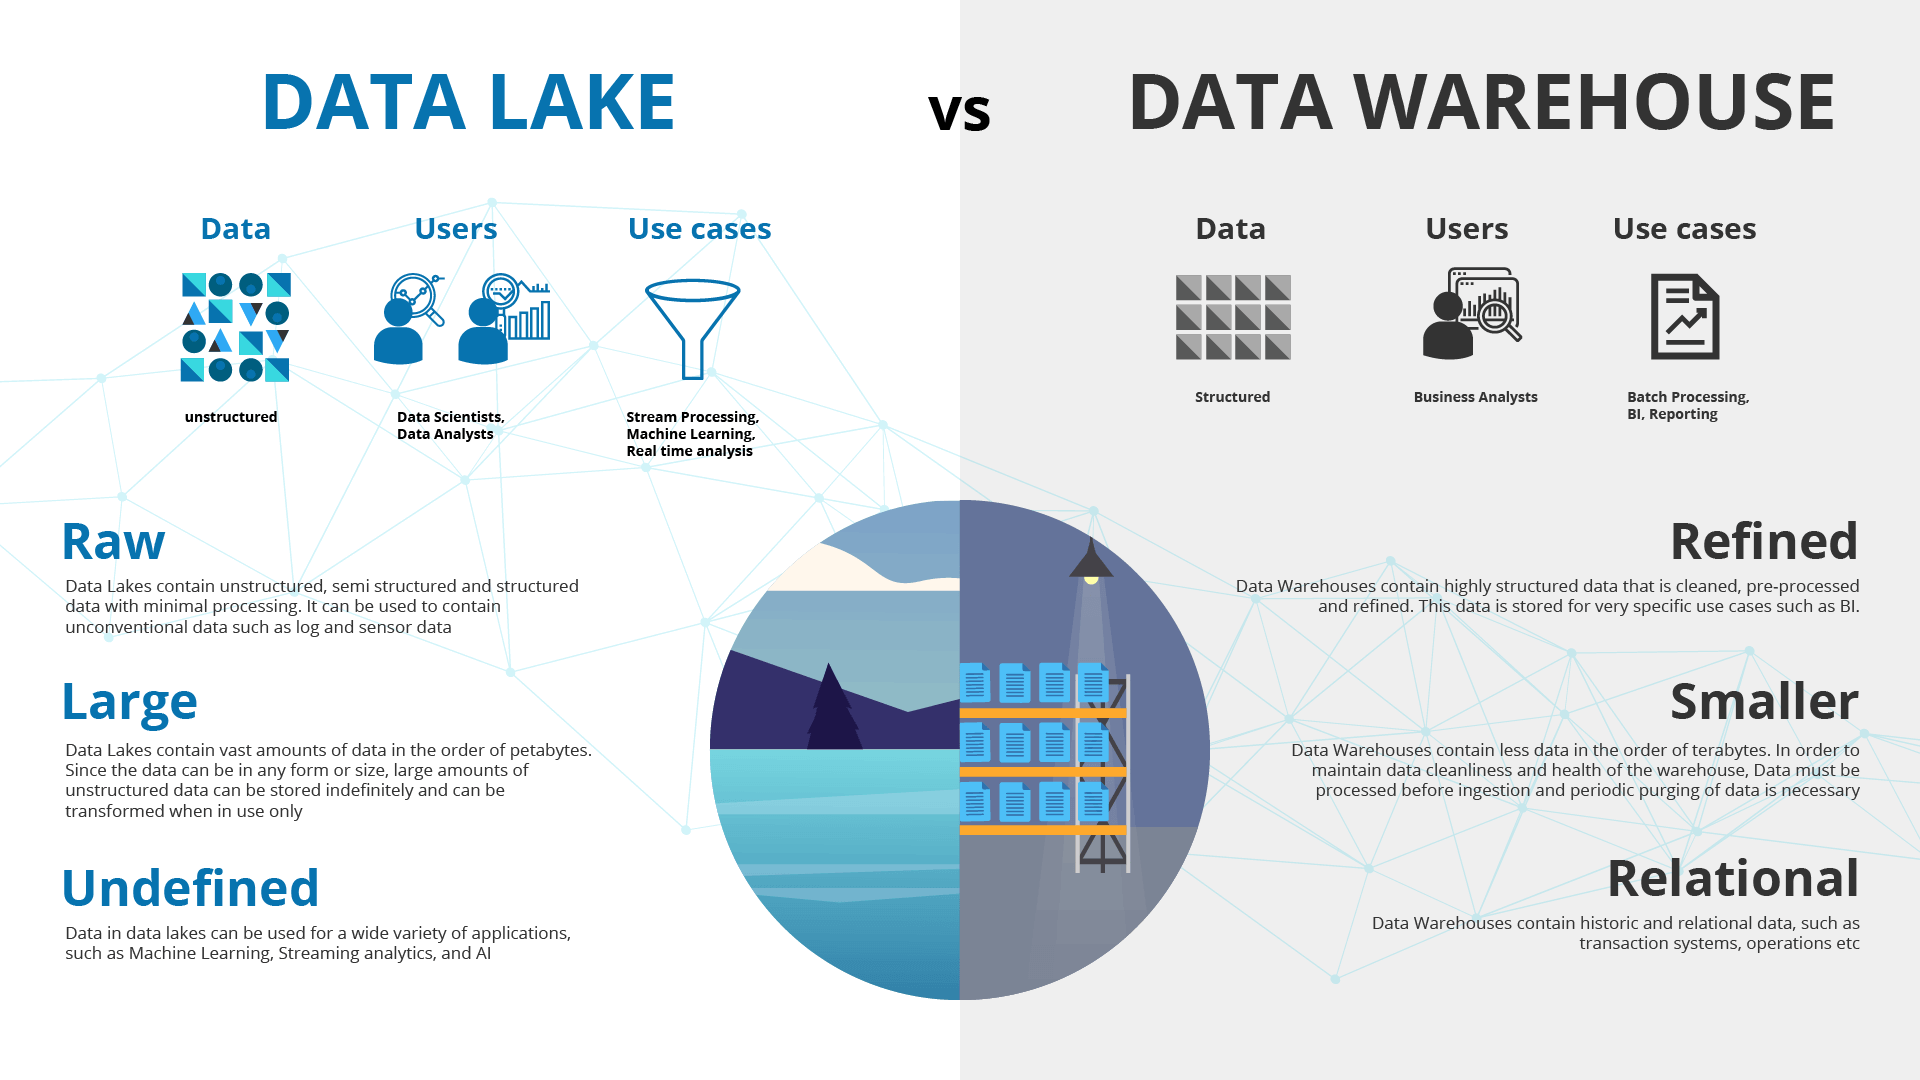
Datawarehouse and data lake Architecture
Datawarehouse
- A data warehouse, or enterprise data warehouse (EDW), is a centralized and integrated repository of data that aggregates data from different sources into a single, central, consistent data store to support data analysis, data mining, artificial intelligence (AI), and machine learning.
- It serves as a structured storage system for collecting and managing large volumes of data from various sources within an organization.
- A data warehouse system enables an organization to run powerful analytics on huge volumes (petabytes) of historical data in ways that a standard database cannot.
- A data warehouse is specially designed for data analytics, which involves reading large amounts of data to understand relationships and trends across the data. A database is used to capture and store data, such as recording details of a transaction.
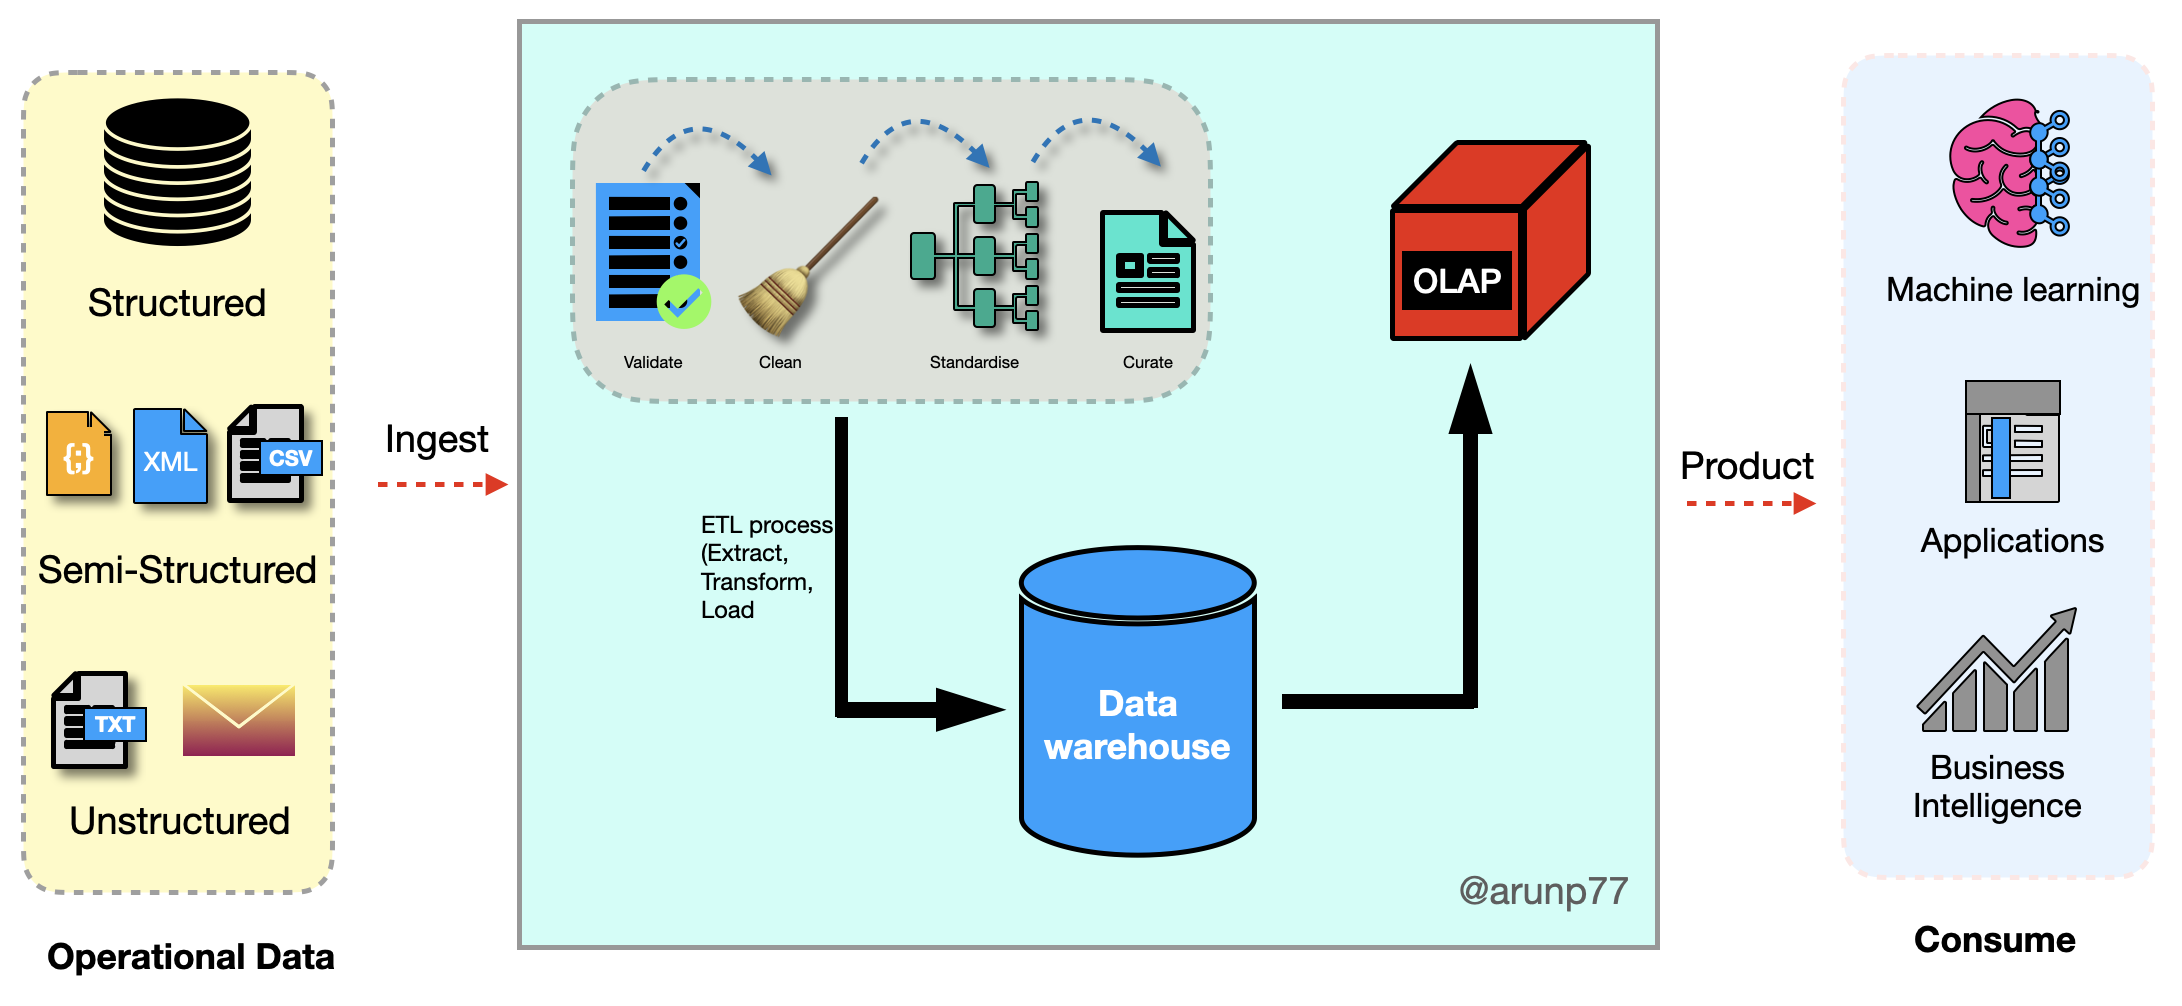
Building Blocks of Data Warehouse
The central and most fundamental building block of a data warehouse is the Data Warehouse itself. It serves as the primary repository for storing and managing data from various source systems. The data warehouse is specifically designed for efficient querying and analysis, making it the core component that enables organizations to consolidate and leverage their data for reporting, business intelligence, and analytics purposes.
Data warehousing involves several building blocks that work together to create an effective data management and analytics environment. Here are the key building blocks of a data warehouse:
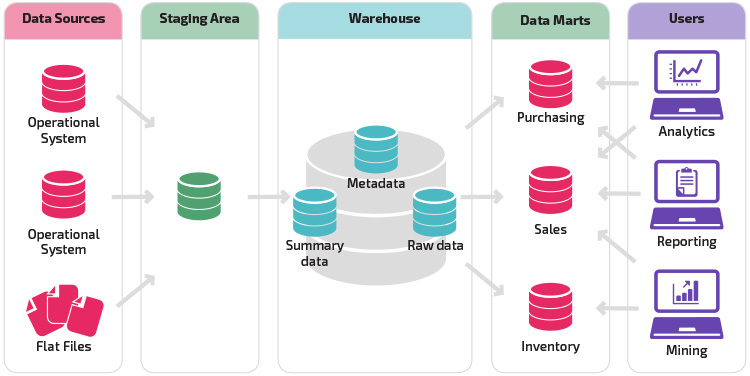
- Source Systems: These are the systems or data repositories where data is generated or collected. Source systems can include databases, applications, spreadsheets, logs, and more.
- Data Extraction (ETL - Extract, Transform, Load): ETL processes extract data from source systems, transform it into a suitable format, and load it into the data warehouse. This step involves data cleansing, validation, and aggregation.
- Staging Area: The staging area is an intermediate storage location where data is temporarily held before being loaded into the data warehouse. It allows for data validation and reconciliation.
- Data Warehouse: The central repository where data from various sources is stored for reporting and analysis. It is structured for efficient querying and analysis.
- Data Marts: Data marts are subsets of the data warehouse designed for specific business units or departments. They store data relevant to particular business areas, making it easier for users to access and analyze the data they need.
- Metadata Repository: Metadata is data about data. A metadata repository stores information about the structure, source, and meaning of the data in the data warehouse. It helps users understand and locate the data they need.
- Business Intelligence (BI) Tools: BI tools are used to query, analyze, and visualize data stored in the data warehouse. They provide a user-friendly interface for creating reports, dashboards, and data visualizations.
While the other components, such as ETL processes, data marts, metadata repositories, and business intelligence tools, play crucial roles in the data warehousing environment, the data warehouse stands as the central hub where data is organized and made accessible to users for decision-making and analysis. It is the backbone of the entire data warehousing architecture.
How does a data warehouse work?
- A data warehouse may contain multiple databases.
- Within each database, data is organized into tables and columns.
- Within each column, you can define a description of the data, such as integer, data field, or string.
- Tables can be organized inside of schemas, which you can think of as folders.
- When data is ingested, it is stored in various tables described by the schema.
- Query tools use the schema to determine which data tables to access and analyze.


Architecture of the datawarehouse
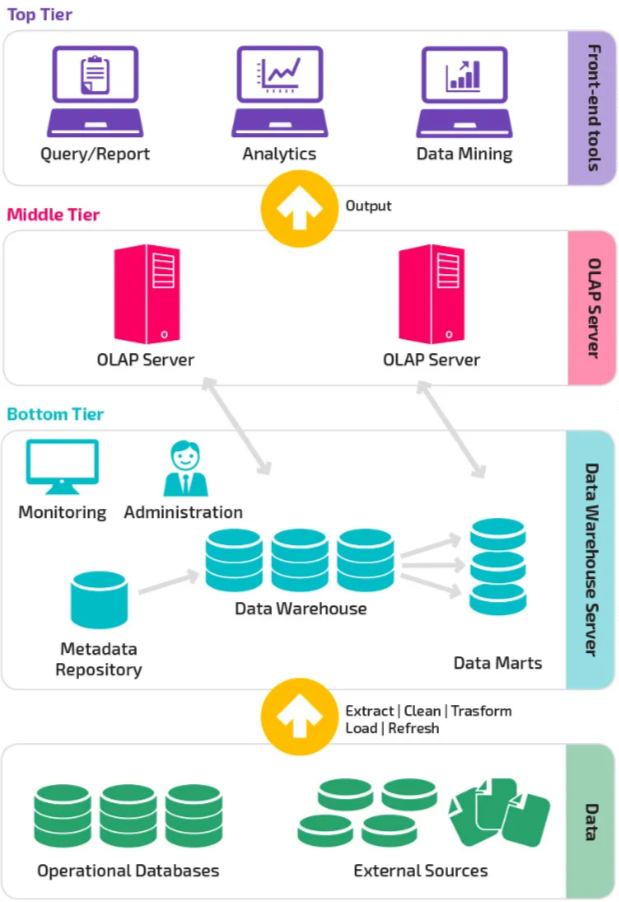
- Data Source Layer (Bottom tier): The bottom tier consists of a data warehouse server, usually a relational database system,
which collects, cleanses, and transforms data from multiple data sources through a process known as Extract, Transform, and Load (ETL) or a
process known as Extract, Load, and Transform (ELT).
- The first tier, often referred to as the bottom tier, consists of various data sources.
- Data is extracted from operational databases, external systems, flat files, or other sources.
- Initial processing may occur at this stage, such as data cleansing and extraction.
- Data Warehouse Layer (Middle tier):
- The second tier, known as the middle tier, is the core data warehouse layer.
- ETL (Extract, Transform, Load) processes operate in this layer to transform raw data into a format suitable for analysis.
- The transformed data is loaded into the data warehouse database, following dimensional modeling principles (star schema or snowflake schema).
- The data warehouse stores structured and organized data, including fact tables (containing metrics) and dimension tables (containing descriptive attributes).
- This layer often includes a staging area for temporary storage before data undergoes transformations.
- ROLAP
- MOLAP
- HOLAP
- Frontend/Client Layer (Top tier): The top tier is represented by some kind of front-end user interface or reporting tool, which enables end users to conduct ad-hoc data analysis on their business data and presents results through reporting, analysis, and data mining tools.
- The third tier, also known as the top tier, is the frontend or client layer.
- Business users interact with this layer to access and analyze the data stored in the data warehouse.
- Business Intelligence (BI) tools, reporting tools, and analytical applications reside in this layer.
- Users can run queries, generate reports, and visualize data to gain insights and make informed decisions.
- OLAP (Online Analytical Processing) engines facilitate multidimensional analysis.
The three-tier architecture of a data warehouse involves three distinct layers, each serving specific functions in the data processing and reporting pipeline. Here's an overview of the three-tier structure:
Datalake
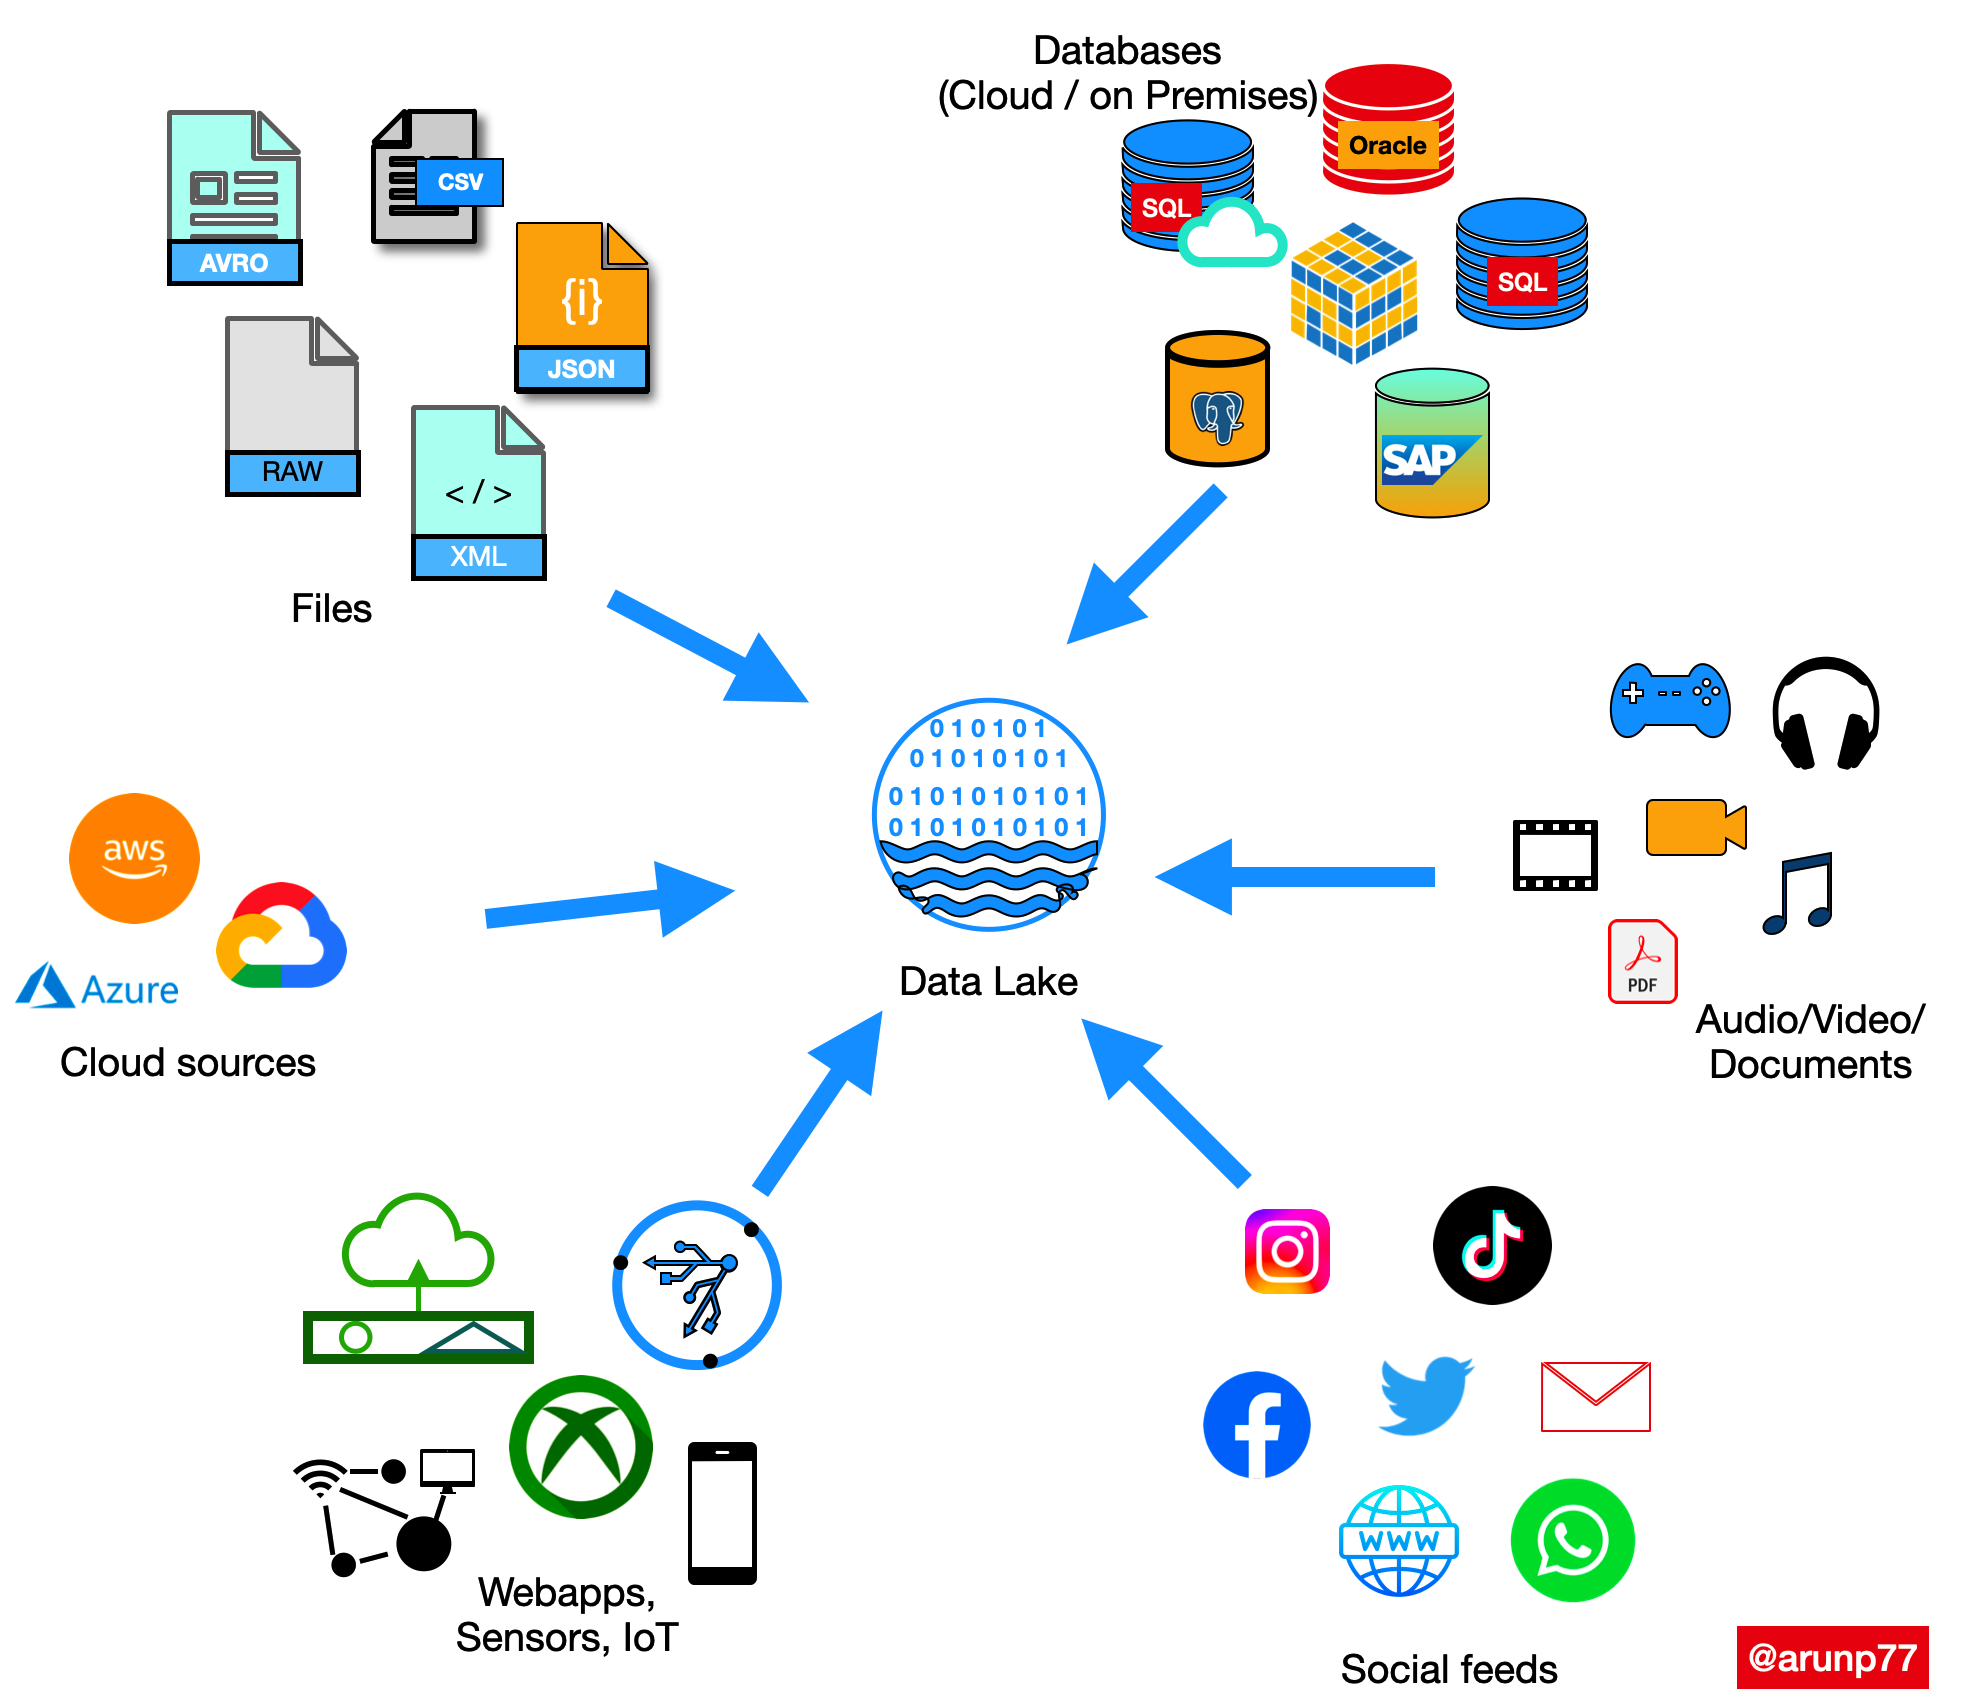
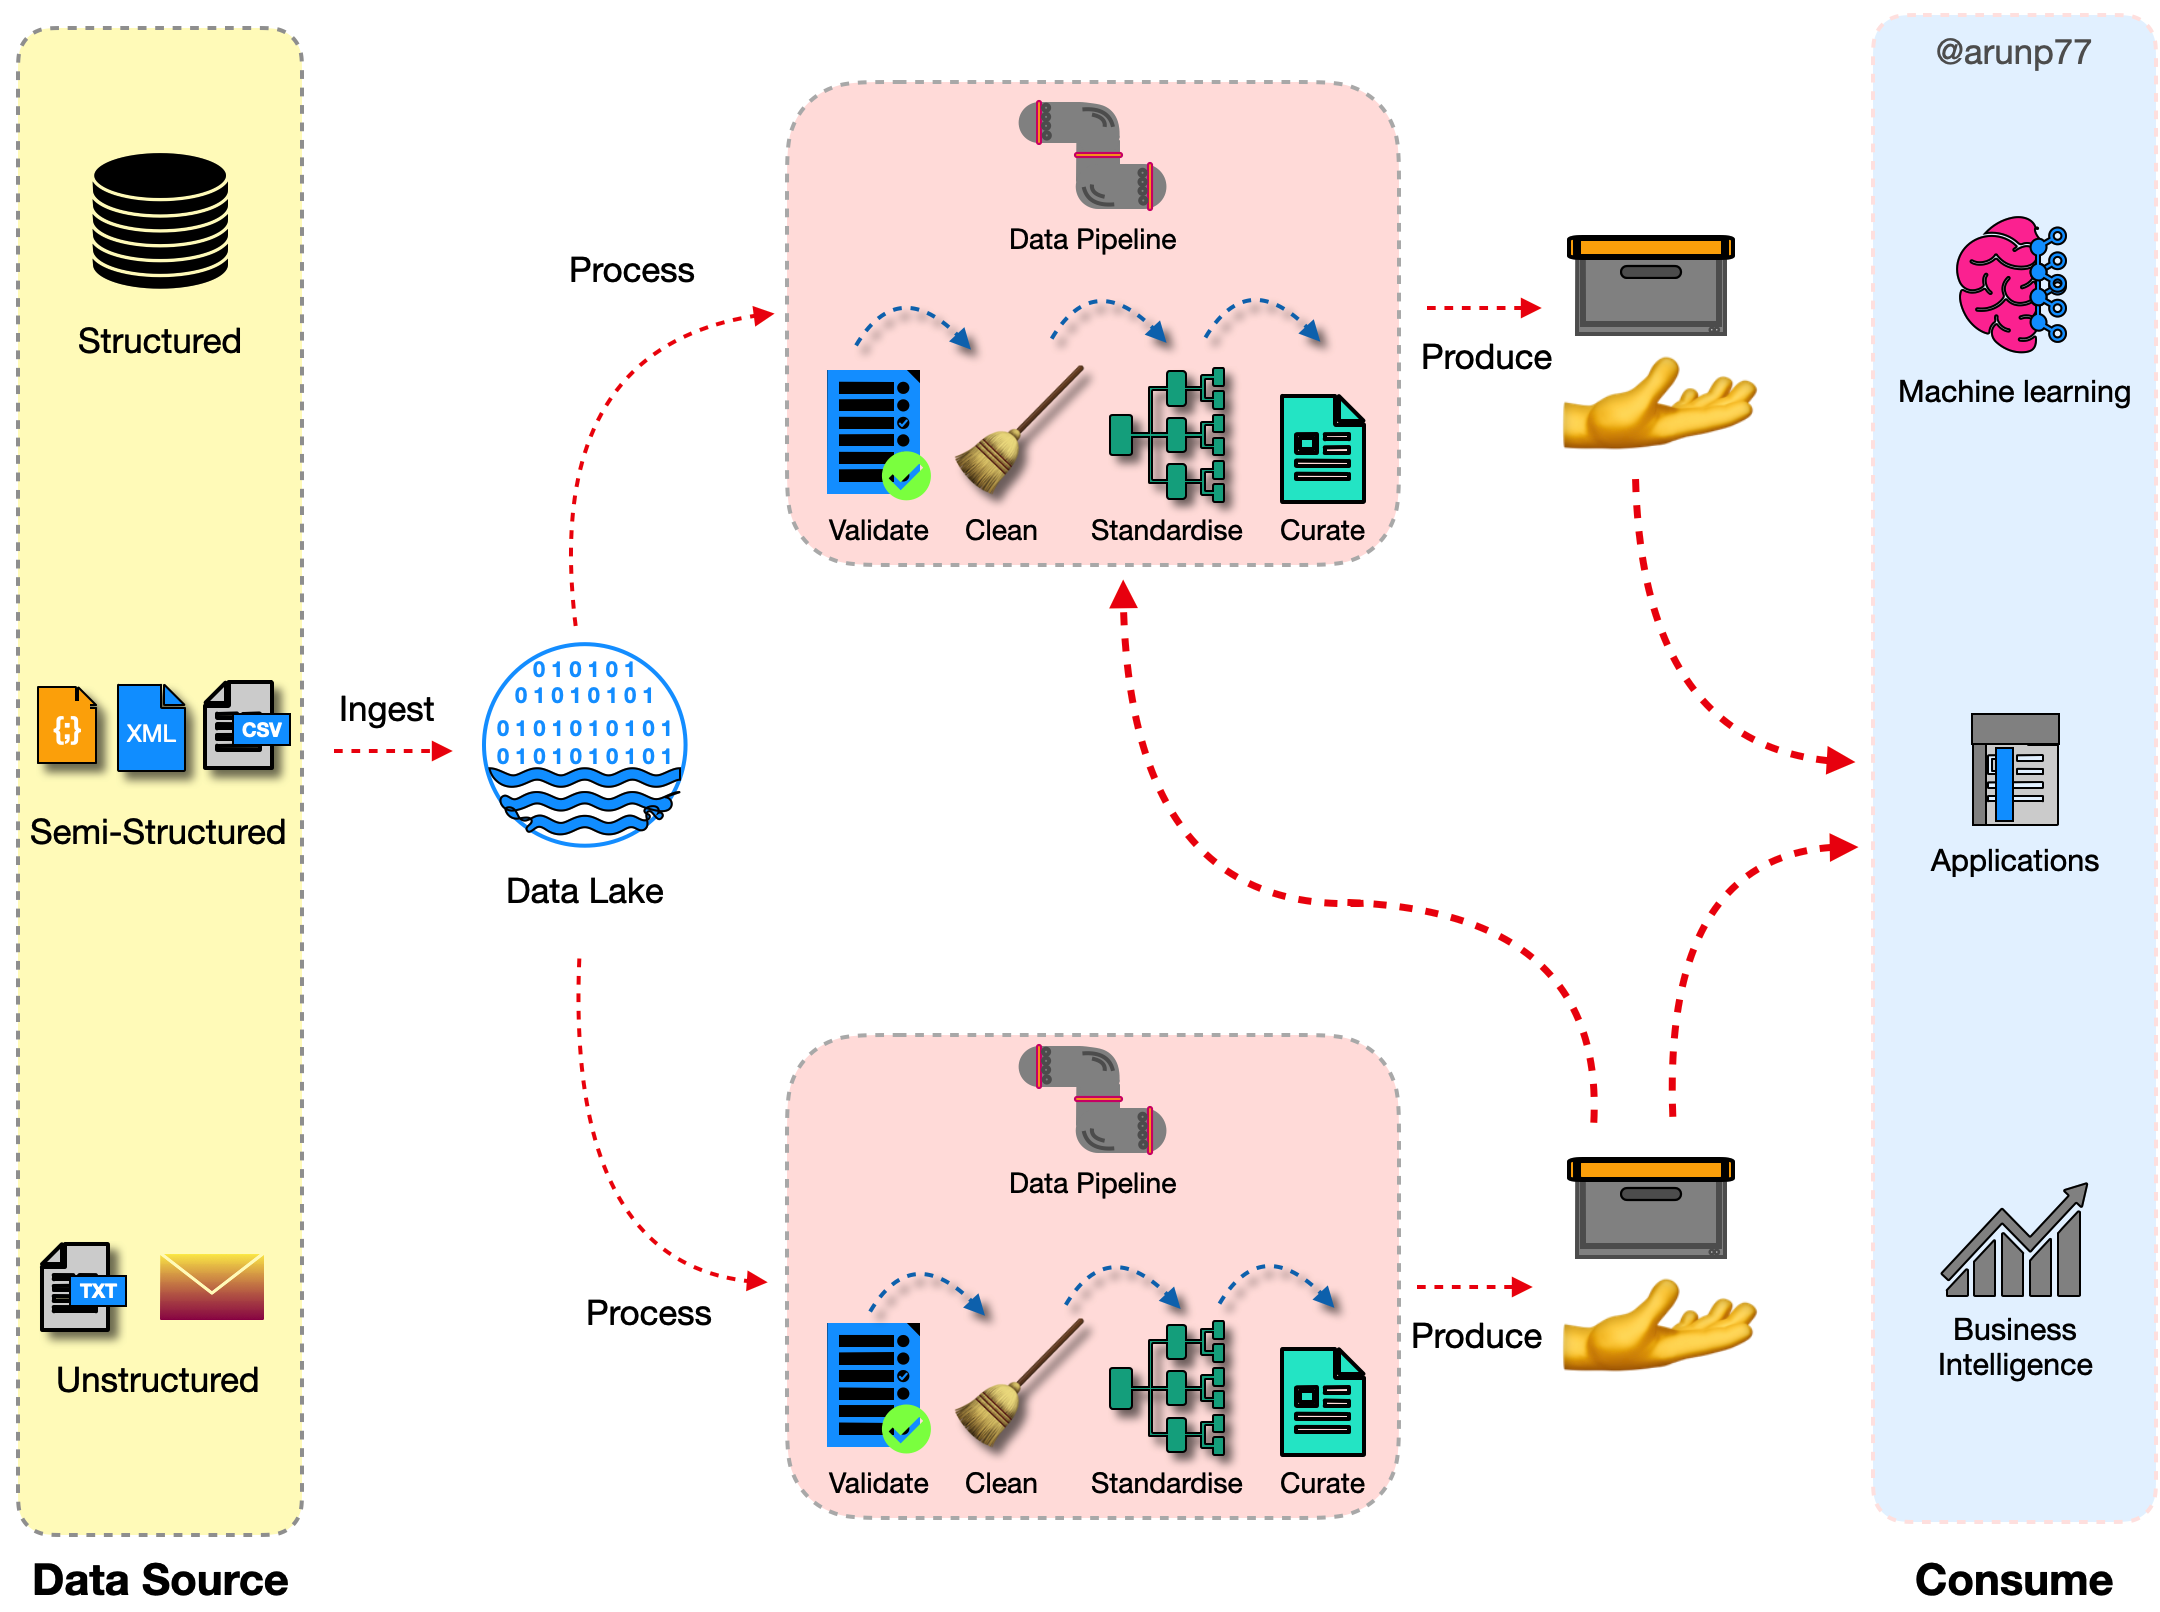
A data lake is a centralized repository that stores all your structured and unstructured data at any scale. You can store your data as-is, without having to structure the data, and run different types of analytics—from dashboards and visualizations to big data processing, real-time analytics, and machine learning to guide better decisions.
Data lakes are often used in conjunction with data warehouses, but they are not the same thing. A data warehouse is a structured data store that is optimized for querying and reporting on historical data. A data lake, on the other hand, is a scalable and flexible data store that can store any type of data, regardless of its structure.
Benefits
Some of the benefits of using a data lake include:
- Scalability: Data lakes can scale to store any amount of data.
- Flexibility: Data lakes can store any type of data, regardless of its structure.
- Performance: Data lakes can be optimized for different types of analytics, including batch processing, real-time analytics, and machine learning.
- Cost-effectiveness: Data lakes can be more cost-effective than traditional data warehouses, especially for storing large amounts of data.
Chalanges
Some of the challenges of using a data lake include:
- Complexity: Data lakes can be more complex to manage and maintain than traditional data warehouses.
- Security: Data lakes need to be properly secured to protect sensitive data.
- Governance: Data lakes need to be properly governed to ensure that data is used in a responsible and ethical manner.
Overall, data lakes are a powerful tool for storing and analyzing large amounts of data. They can be used to support a wide range of business applications, including customer intelligence, fraud detection, and product development.
Applications
Here are some examples of how data lakes are being used in the real world:
- Retail: Retailers use data lakes to store and analyze customer data, product data, and sales data. This data can be used to improve customer targeting, product recommendations, and inventory management.
- Finance: Financial institutions use data lakes to store and analyze customer data, transaction data, and market data. This data can be used to improve risk management, fraud detection, and investment decisions.
- Healthcare: Healthcare organizations use data lakes to store and analyze patient data, medical research data, and clinical trial data. This data can be used to improve patient care, develop new treatments, and reduce costs.
Database vs Data warehouse vs data lake vs data mart
Data lakes are a powerful tool for storing and analyzing large amounts of data. They can be used to support a wide range of business applications, and they are becoming increasingly important as the amount of data that businesses collect and store continues to grow.
| Aspect | Database | Data Warehouse | Data Lake | Data Mart |
|---|---|---|---|---|
| Purpose | Designed for transactional data management. | Designed for analytical processing. | Designed for storing raw, unstructured data. | Subset of a data warehouse focused on specific business areas. |
| Data Type | Typically contains structured, transactional data. | Contains integrated and historical data. | Stores raw and structured, semi-structured, or unstructured data. | Contains summarized and pre-aggregated data for specific use cases. |
| Data Structure | Follows a normalized schema (relational database model). | Typically follows a structured schema (Star Schema or Snowflake Schema). | Schema-on-read, allowing flexible data structures. | Follows a dimensional model (Star Schema) for ease of reporting. |
| Schema Design | Optimized for efficient data storage and retrieval. | Optimized for query performance. | Flexible schema, data can be ingested without predefined structure. | Designed for ease of reporting and analysis. |
| Query and Analytics | Supports simple queries and transactional operations. | Designed for complex data analysis and reporting. | Suitable for ad-hoc queries and big data analytics. | Optimized for specific business units or departments' analytics. |
| Data Integration | Typically focuses on data from a single application or system. | Integrates data from various sources for a unified view. | Supports data from various sources with varying structures. | Integrates data relevant to a specific business area. |
| Performance Optimization | Optimized for ACID (Atomicity, Consistency, Isolation, Durability) properties. | Utilizes indexing, caching, and parallel processing. | Performance tuning is performed during data processing. | Designed for fast query response times for specific use cases. |
| Scalability | Scalability depends on the database system; typically vertical scaling. | Scalable both vertically and horizontally to handle large data volumes. | Scales horizontally to accommodate growing data needs. | Scales according to the needs of the specific business area. |
| Tools and Technologies | Utilizes relational database management systems (e.g., Oracle, MySQL). | Uses specialized data warehousing solutions (e.g., Redshift, BigQuery). | Utilizes distributed storage systems (e.g., Hadoop, Azure Data Lake Storage). | May use BI tools for reporting and analytics. |
| Use Cases | Transactional applications, e-commerce, record-keeping. | Business intelligence, reporting, complex analytics. | Big data analytics, data science, machine learning. | Department-specific analytics, budgeting, and forecasting. |
Tools used to intergrate the warehouses, databases, and data lakes
Integrating data warehouses, databases, and data lakes often involves a combination of tools and technologies to facilitate data movement, transformation, and synchronization across these components. Here are some commonly used tools and methods for integrating them:
ETL (Extract, Transform, Load) Tools:
- ETL tools are designed to extract data from source systems, transform it into the desired format, and load it into a target system, which can be a data warehouse, database, or data lake.
Popular ETL tools include
- Apache NiFi,
- Talend,
- Informatica PowerCenter,
- Microsoft SQL Server Integration Services (SSIS), and
Apache Spark
for batch and stream processing.
Data Integration Platforms:
- These platforms provide a comprehensive solution for data integration, including data profiling, cleansing, transformation, and loading.
Examples include
- Apache Nifi,
- Apache Camel, and
Apache Kafka
for stream processing.
Data Integration Middleware:
- Middleware solutions facilitate communication and data transfer between different systems, including data warehouses, databases, and data lakes.
Tools:
- Apache Kafka,
- RabbitMQ, and
Apache Pulsar
are often used for real-time data streaming and messaging.
Data Replication Tools:
- Data replication tools enable real-time or near-real-time data synchronization between databases and data warehouses.
Solutions:
- Oracle GoldenGate,
- AWS Database Migration Service, and
Microsoft Azure Data Factory
offer data replication capabilities.
Data Virtualization Tools:
- Data virtualization allows organizations to create a unified, virtual view of data spread across different sources without physically moving it.
Tools:
- Denodo,
- Informatica Enterprise Data Catalog, and
Red Hat JBoss Data Virtualization
offer data virtualization capabilities.
APIs and Web Services:
- APIs (Application Programming Interfaces) and web services can be used to exchange data between systems programmatically.
- RESTful APIs, SOAP APIs, and GraphQL are common protocols for data integration via web services.
Custom Scripting and Coding:
- For highly customized integration requirements, organizations may develop custom scripts or code using programming languages like Python, Java, or Ruby.
Data Lake Services:
- Cloud-based data lake services like AWS Lake Formation, Azure Data Lake Storage, and Google Cloud Storage often provide built-in tools for integrating data with various data warehousing and database services.
Data Integration Platforms as a Service (iPaaS):
- iPaaS solutions offer cloud-based platforms for connecting various applications and data sources, including data lakes, data warehouses, and databases.
- Examples include Dell Boomi, MuleSoft Anypoint Platform, and SnapLogic.
Change Data Capture (CDC) Tools:
- CDC tools monitor changes in source data and capture them in real-time or batch mode for integration with target systems.
- Tools like Debezium and Apache Nifi support CDC functionality.
The choice of tools depends on your specific integration requirements, the technology stack you are using, and whether you are working with on-premises or cloud-based data systems. Many organizations use a combination of these tools and methods to create a robust and efficient data integration strategy that connects data across data warehouses, databases, and data lakes.
OLAP and OLTP systems
A Data Warehouse is a central repository (Centralized Database) where all the enterprise data coming from different resources is stored, managed, and analyzed for gaining business insights. The data which comes in different formats can be stored in a warehouse and is accessed using some business intelligence tools to query the business problems.
This data is ingested through ETL (Extraction Transformation and Loading) Operations and then is analyzed using OLAP or OLTP System, whichever is used. This process of querying the business data for decisions using a centralized database is called Data Warehousing.
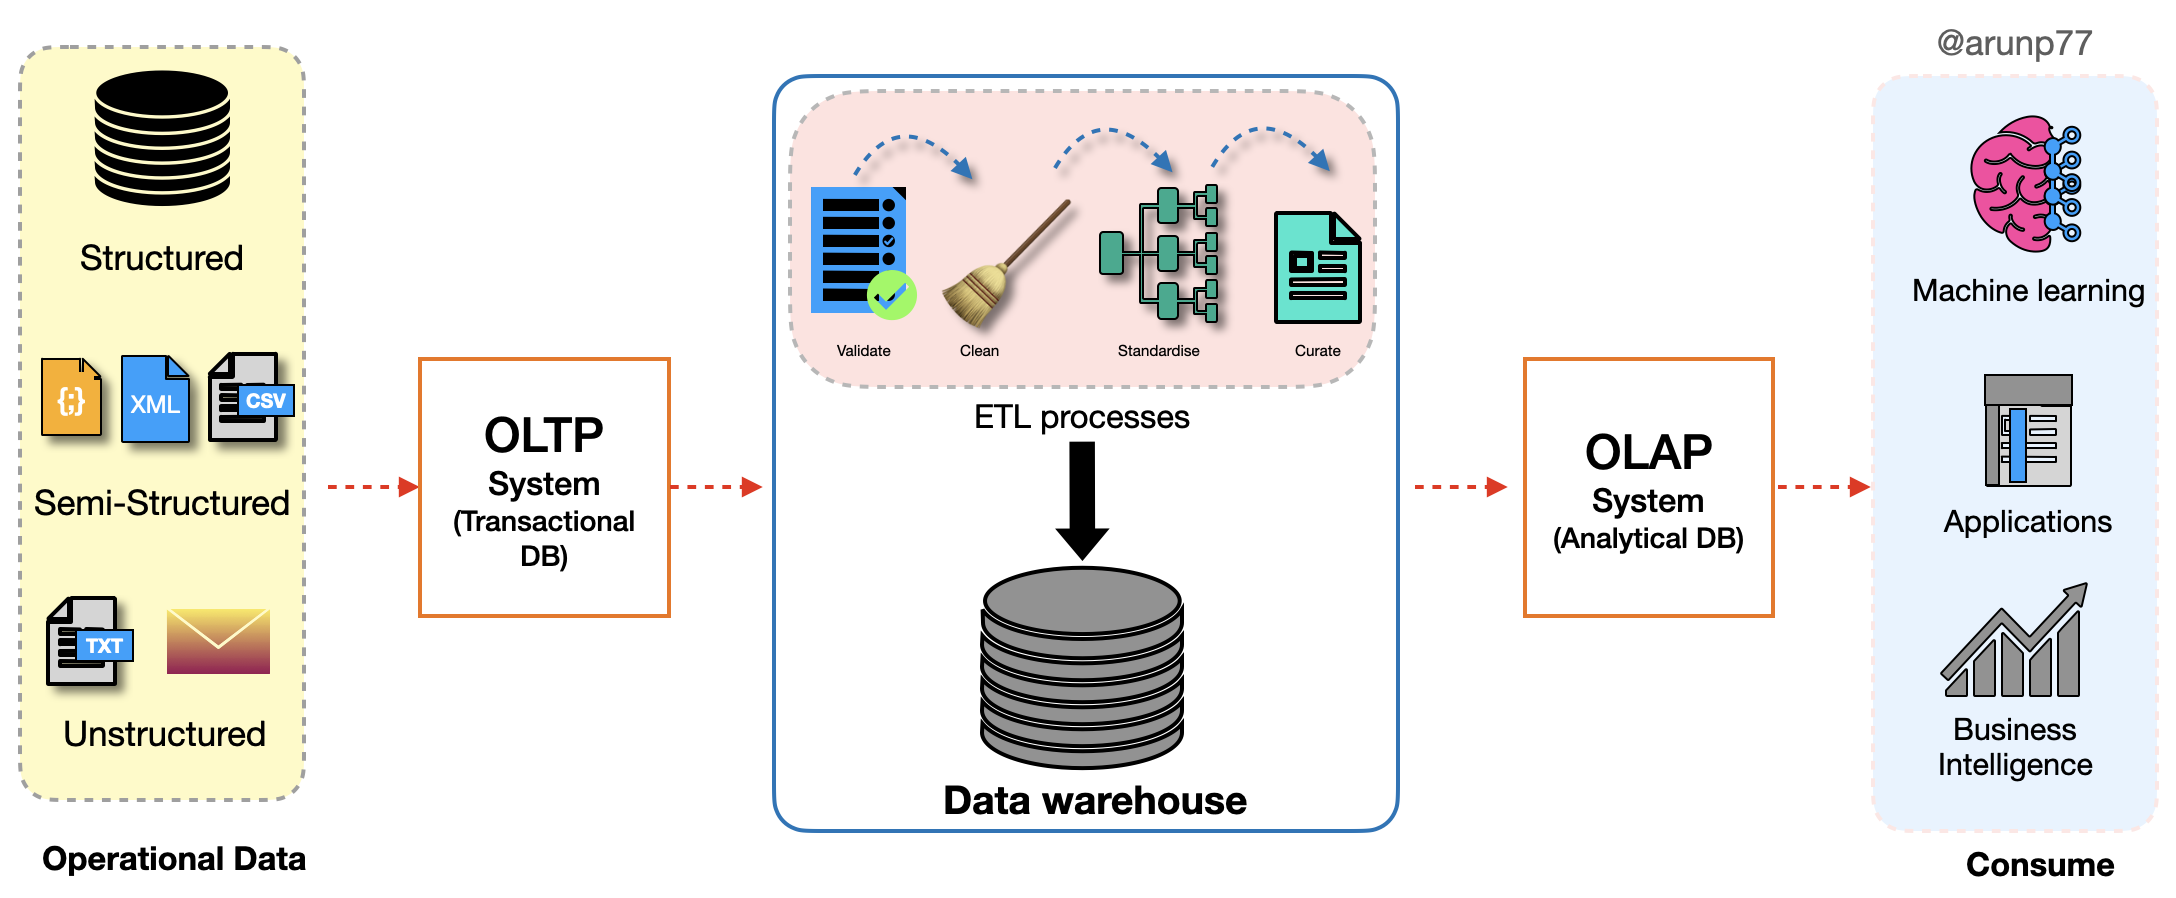
- What is OLAP? OLAP stands for Online Analytical Processing System. This Data Processing System is used for multidimensional analysis of large volumes of Data. It is mostly preferred for Data Mining (Extracting patterns in Large volumes of data), Business Intelligence, and Complex Analytical Calculations like Budget Forecasting, Sales Analysis, etc.
- What is OLTP? OLTP or Online Transaction Processing System is used to enable real-time executions of huge numbers of transactions by a large number of users.
Here, the Transaction means a single unit of work that is done to modify the data in the database.
For example, as soon as you withdraw money from the bank, your account balance reflects changes instantly. Or, when you change your account password, it is changed instantly without a delay. These are the daily life examples of Transaction Processes in the Database handled using the OLTP System. This is the main difference between OLAP and OLTP.
| Aspect | OLAP (Online Analytical Processing) | OLTP (Online Transactional Processing) |
|---|---|---|
| OLAP is used for complex, multi-dimensional analysis of historical data from data warehouses to support business intelligence and decision-making. | OLTP is used for managing and processing high volumes of real-time transactional data, such as order processing and inventory management, in databases. | |
| Nature of Processing | Analytical: Focuses on complex data analysis. | Transactional: Focuses on real-time transactions. |
| Data Type | Typically processes historical and aggregated data. | Processes recent and detailed transactional data. |
| Usage | Data mining, business intelligence, reporting, complex calculations, forecasting. | E-commerce, ATM transactions, payment processing, reservations, record-keeping. |
| Data Structure | Multidimensional, often uses data warehousing. | Relational, follows a normalized schema. |
| Query Complexity | Handles complex queries involving aggregations and calculations. | Handles simple queries for transaction processing. |
| Performance | Query performance is optimized for large-scale data analysis. | Transaction processing is optimized for speed and concurrency. |
| Data Volume | Deals with large volumes of data. | Typically handles smaller, real-time datasets. |
| Concurrency | Supports a lower level of concurrent users. | Supports a higher level of concurrent users. |
| Database Size | Database size is usually larger. | Database size is comparatively smaller. |
| Backup and Recovery | Backup and recovery strategies may vary. | Requires robust backup and recovery mechanisms. |
| Schema Design | Often uses denormalized schema (Star Schema). | Follows a normalized schema (Third Normal Form). |
| Indexing | Indexing is critical for query performance. | Indexing is important for transaction speed. |
| Examples | Business intelligence tools, data warehouses. | E-commerce platforms, banking systems. |
- OLTP (Online Transaction Processing): MYSQL, PostgreSQL, Oracle Database, Microsoft SQL Server.
- OLAP (Online Analytical Processing): Hive, Google BigQuery, Amazon Redshift, Snowflake, SAP HANA, Microsoft SQL Server Analysis Services (SSAS).
- Dual Purpose (OLAP and OLTP Capabilities): Microsoft SQL Server.
Keep in mind that OLAP and OLTP serve different purposes within an organization, and the choice between them depends on the specific business requirements and the types of applications being used.
Types of OLAP
OLAP (Online Analytical Processing) is a category of software and technology used for multidimensional data analysis. There are two primary types of OLAP systems:
- MOLAP (Multidimensional OLAP)
- ROLAP (Relational OLAP)
- HOLAP (Hybrid OLAP)
- MOLAP (Multidimensional OLAP):
- Advantages:
- Fast Query Performance: MOLAP databases are optimized for multidimensional queries, making them exceptionally fast for analytical and ad-hoc queries.
- Aggregation Support: They support pre-aggregated data cubes, which are beneficial for summarizing and analyzing large datasets.
- Data Compression: MOLAP systems often employ efficient compression techniques to reduce storage requirements.
- Disadvantages:
- Storage Overhead: The storage requirements for MOLAP can be significant due to the pre-aggregated data.
- Data Loading Time: Loading data into MOLAP databases can be time-consuming, especially for large datasets.
- Limited Scalability: Scalability can be an issue when dealing with very large datasets.
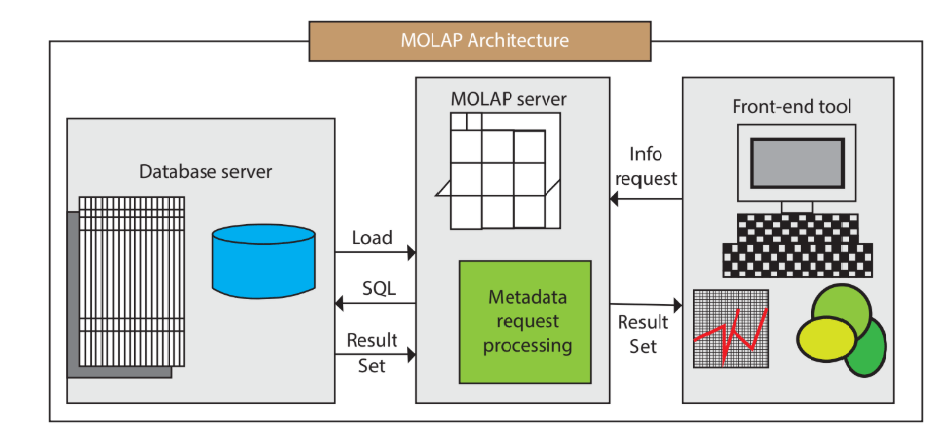
Image credit: javapoint - Advantages:
- ROLAP (Relational OLAP):
- Advantages:
- Scalability: ROLAP systems can handle very large datasets and are suitable for organizations with extensive data volumes.
- Flexibility: They work with existing relational database management systems (RDBMS), making them compatible with a wide range of data sources.
- Data Integration: ROLAP systems can seamlessly integrate with other business applications and processes.
- Disadvantages:
- Query Performance: Analytical queries in ROLAP can be slower than MOLAP due to the relational nature of data storage.
- Complexity: Designing and maintaining ROLAP systems can be more complex, as they often require writing complex SQL queries.
- Lack of Aggregation: ROLAP systems may require more effort to create and manage aggregated data for performance optimization.
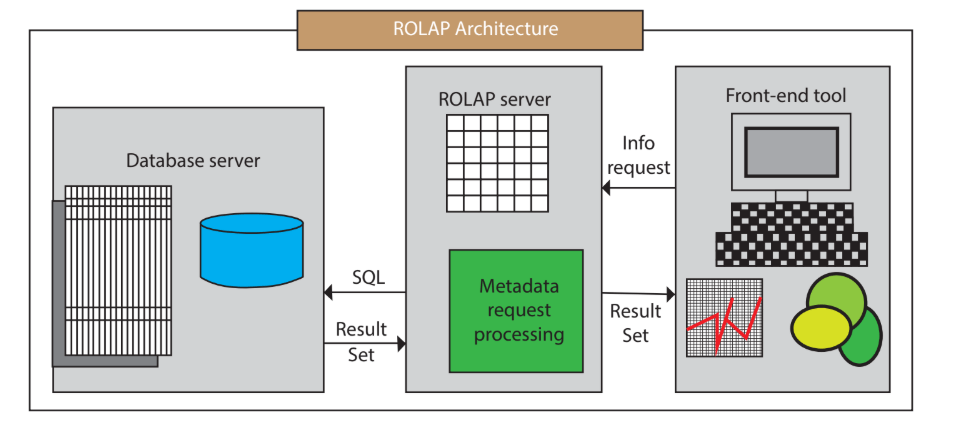
Image credit: javapoint - Advantages:
- HOLAP (Hybrid OLAP):
HOLAP systems aim to combine the advantages of both MOLAP and ROLAP while mitigating their disadvantages. Here are some characteristics:
- Advantages:
- Combines Speed and Scalability: HOLAP systems attempt to provide the query speed of MOLAP with the scalability of ROLAP.
- Flexible Storage: They allow for a mix of pre-aggregated and relational data storage, providing more flexibility in data management.
- Adaptable to Varying Data Needs: HOLAP can dynamically switch between storage modes based on query complexity.
- Disavantages:
- Complex to Implement: Setting up HOLAP systems can be more complex than MOLAP or ROLAP alone.
Potential Performance Trade-offs: While HOLAP aims to balance speed and scalability, it may not achieve the same query performance as pure MOLAP systems.
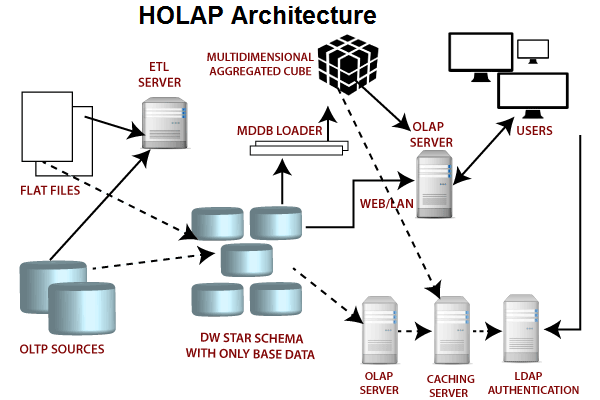
Image credit: javapoint
- Advantages:
The choice between MOLAP, ROLAP, or HOLAP depends on an organization's specific requirements, data volume, query performance needs, and existing technology infrastructure. In practice, some organizations use a combination of these OLAP types to address different aspects of their analytical needs.
OLAP operation
OLAP (Online Analytical Processing) operations are a set of data manipulation techniques used for querying and analyzing multidimensional data stored in OLAP databases or data cubes. These operations help users gain insights from large datasets quickly and effectively. There are several fundamental OLAP operations:
Slice: Slicing involves selecting a single dimension from a multidimensional cube to view a "slice" of the data. This operation allows users to focus on a specific dimension's values while keeping all other dimensions constant. For example, you can slice a sales data cube to view sales figures for a particular product category across different time periods.
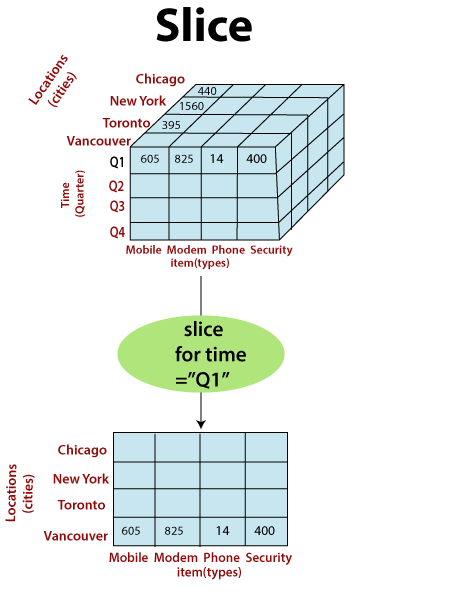
Image credit: javapoint Dice: Dicing is similar to slicing but involves selecting specific values or ranges within multiple dimensions simultaneously. It allows users to create a subcube by specifying conditions for multiple dimensions. For instance, you could dice a data cube to examine sales data for a particular region, product category, and time frame.
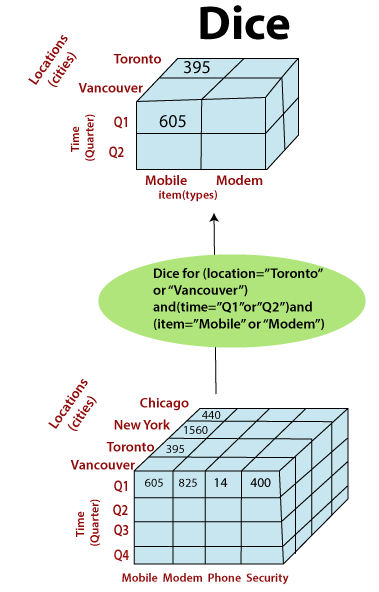
Image credit: javapoint Roll-up (Climb): Roll-up involves aggregating data from a lower-level dimension to a higher-level dimension. It moves up the hierarchy to see summarized or aggregated data. For instance, you can roll up sales data from daily to monthly or yearly totals to get a broader perspective.
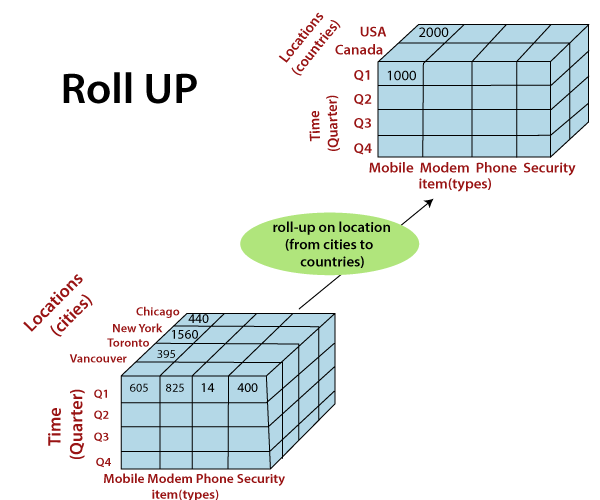
Image credit: javapoint Drill-down (Dig): Drill-down is the opposite of roll-up. It involves breaking down aggregated data into more detailed levels. Users can explore data at finer granularity by drilling down. For example, you can drill down from yearly sales to monthly, weekly, or daily sales figures.
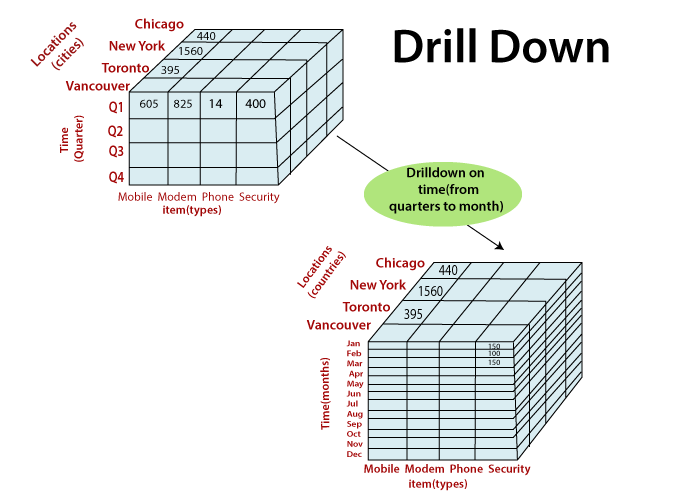
Image credit: javapoint Pivot (Rotate): Pivoting reorients the data cube to view it from a different perspective. It involves swapping the dimensions, which can provide alternative views of the data. Pivoting can help users analyze data from various angles and dimensions.
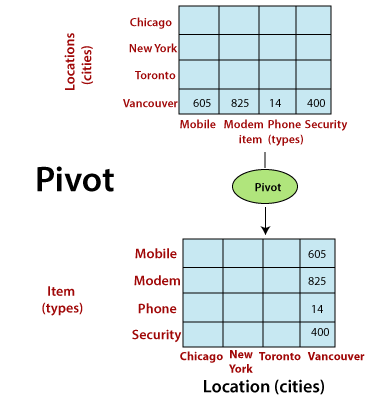
Image credit: javapoint
These OLAP operations are essential for business intelligence, reporting, and decision support systems. They enable users to navigate and explore multidimensional data efficiently, making it easier to discover insights and make informed decisions. The specific operations and functionalities may vary depending on the OLAP system or tool being used.
Some other interesting things to know:
- Visit Data warehouse dimension modeling
- Visit the Data mining tutorial
- Visit my repository on GitHub for Bigdata, Databases, DBMS, Data modling, Data mining.
- Visit my website on SQL.
- Visit my website on PostgreSQL.
- Visit my website on Slowly changing variables.
- Visit my website on SNowflake.
- Visit my website on SQL project in postgresql.
- Visit my website on Snowflake data streaming.

