
Dimension modeling
Introduction to dimensional modeling
- Warehouse dimensional modeling is a data modeling technique used to store and organize data in a data warehouse. It is a way of organizing data so that it is easy to query and analyze.
- It's particularly valuable when dealing with large datasets and complex business questions.
- Warehouse dimensional modeling is a powerful technique for storing and organizing data in a data warehouse. It makes it easy to query and analyze data, and it can be used to support a wide range of business intelligence and data warehousing applications.
- Warehouse dimensional modeling is based on the concept of dimensions and facts.
- Dimensions: These are attributes by which you want to analyze your data. Common dimensions include time, geography, product, customer, and more, depending on the domain.
- Dimensions often have hierarchies. For example, a time dimension might have a hierarchy of Year > Quarter > Month > Day. Hierarchies enable drill-down analysis.
- Facts are quantitative measurements of data, such as sales, inventory, and website traffic.
Objectives of Dimensional Modeling
The purposes of dimensional modeling are:
- To produce database architecture that is easy for end-clients to understand and write queries.
- To maximize the efficiency of queries. It achieves these goals by minimizing the number of tables and relationships between them.
Types of tables in dimensional modeling
In a warehouse dimensional model, data is stored in two types of tables:
- Dimension tables:
- Each dimension table contains attributes related to that dimension. For example, a "Time" dimension might have attributes like Year, Quarter, Month, and Day.
- Dimension tables are typically normalized, which means that they are organized in such a way that each attribute is only stored once.
- Fact tables:
- These are measurable data points or metrics you want to analyze, such as sales revenue, quantity sold, or profit.
- Foreign keys: Fact tables typically contain "foreign keys" that link to dimension tables. These foreign keys establish relationships between dimensions and facts.
- Contrary to dimension table, fact tables, are typically denormalized, which means that they may contain redundant data. This is done to improve query performance.
Dimension tables contain data about the dimensions, and fact tables contain data about the facts.
Disadvantages of Dimensional Modeling
- To maintain the integrity of fact and dimensions, loading the data warehouses with a record from various operational systems is complicated.
- It is severe to modify the data warehouse operation if the organization adopting the dimensional technique changes the method in which it does business.
- Example:
- Retail: Retailers use warehouse dimensional modeling to analyze customer data, product data, and sales data. This data can be used to improve customer targeting, product recommendations, and inventory management.
- Finance: Financial institutions use warehouse dimensional modeling to analyze customer data, transaction data, and market data. This data can be used to improve risk management, fraud detection, and investment decisions.
- Healthcare: Healthcare organizations use warehouse dimensional modeling to analyze patient data, medical research data, and clinical trial data. This data can be used to improve patient care, develop new treatments, and reduce costs.
Here are some examples of how warehouse dimensional modeling is used in the real world:
Warehouse dimensional modeling is a powerful technique that can be used to support a wide range of business applications.
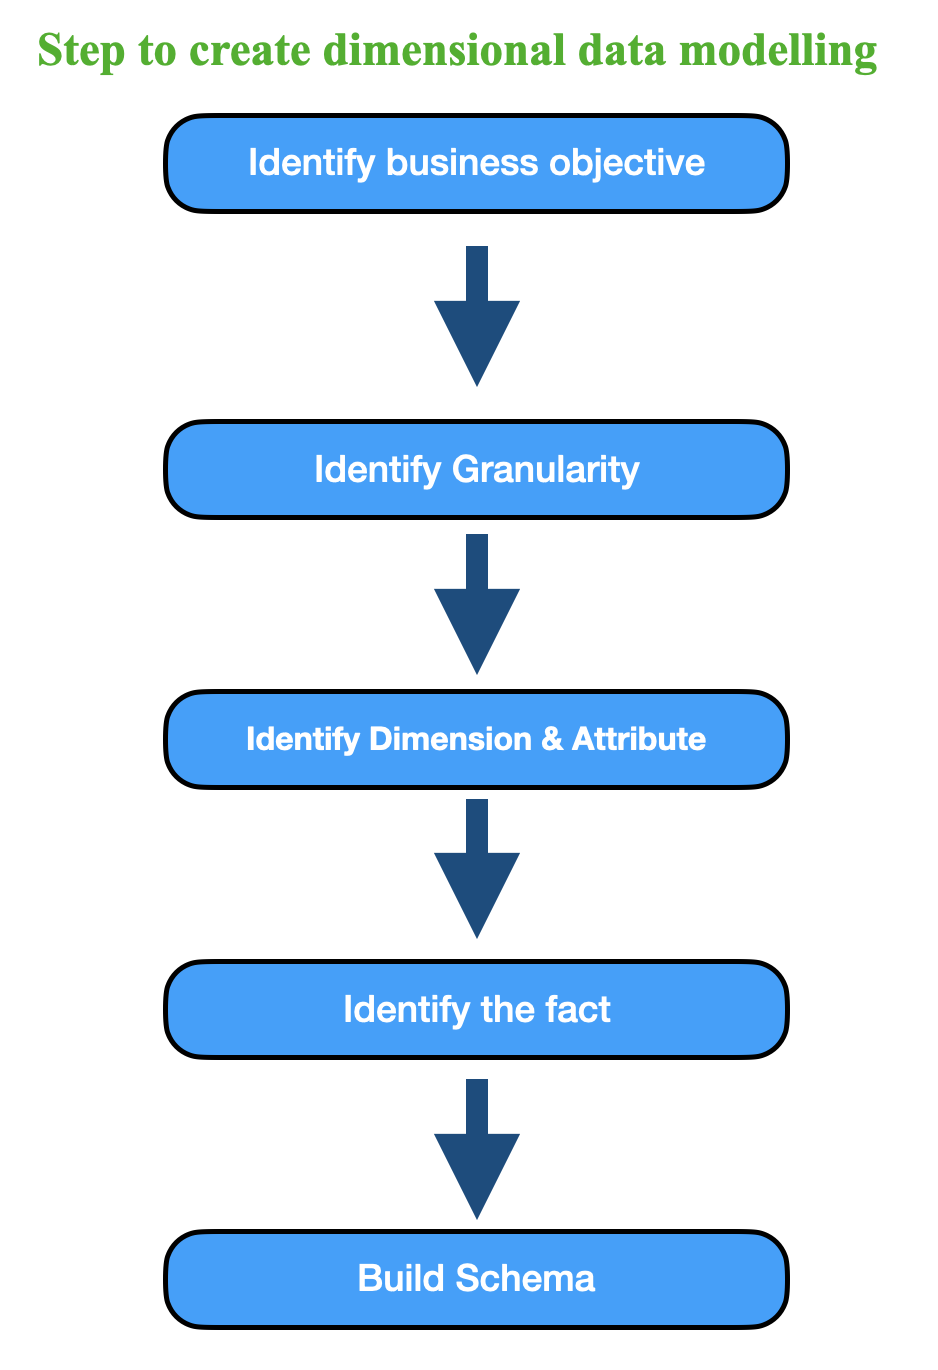
Steps to creat a dimensional data model
Dimesnion modeling schema
- the star schema
- the snowflake schema.
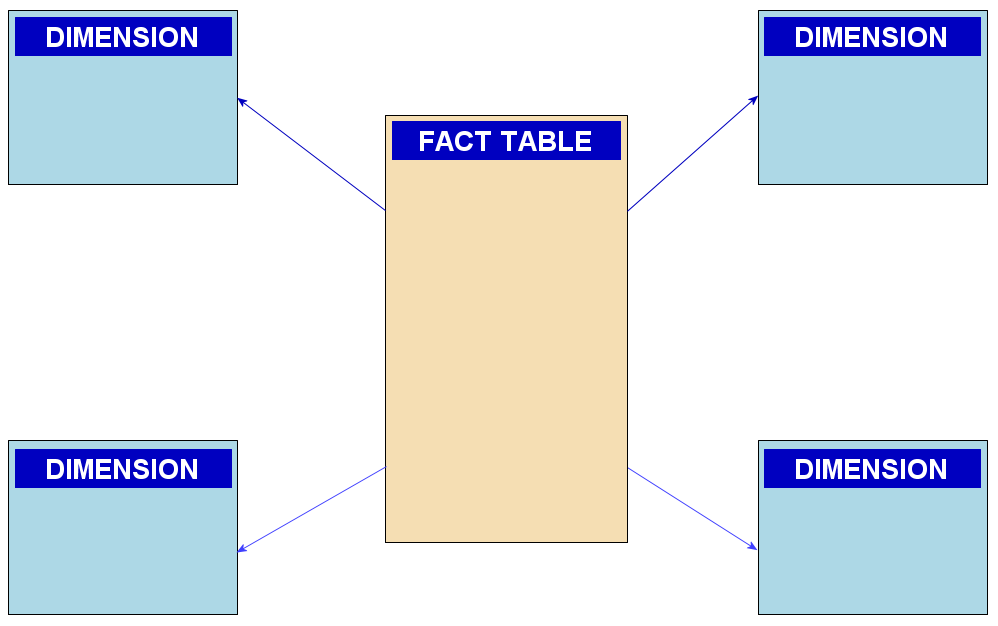
- Star Schema: The star schema is a denormalized design where dimension tables are fully denormalized, making them highly readable and efficient for querying.
- Characteristics:
- Fact table at the center: A central fact table holds quantitative data, surrounded by dimension tables.
- Denormalized dimensions: Each dimension table is denormalized, containing all the necessary attributes, including hierarchies.
- Simple to understand: Star schemas are intuitive and straightforward for end users to work with.
- Advantages:
- Fast query performance: Queries are typically faster due to denormalized dimensions.
- Simplified reporting: Users can easily create reports and perform ad-hoc analysis.
- Suitable for data warehousing and analytics.
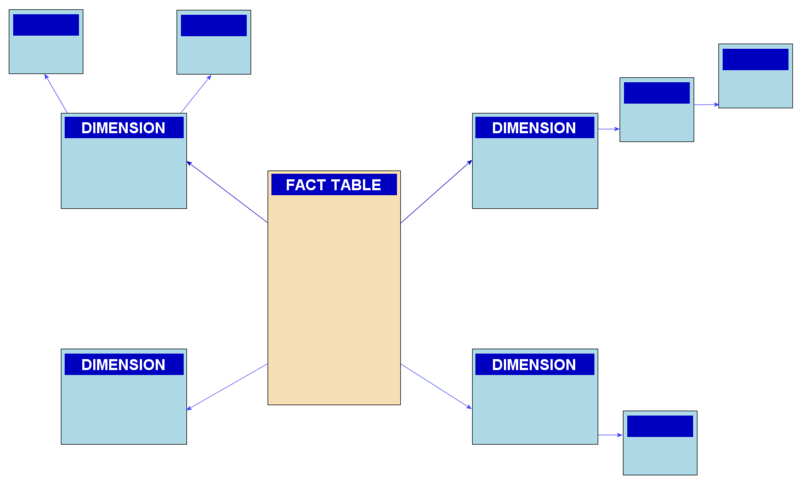
- Snowflake Schema: The snowflake schema is a normalized design where dimension tables are partially or fully normalized. It can be viewed as an extension of the star schema.
- Characteristics:
- Dimension table normalization: In a snowflake schema, dimension tables might be normalized to reduce data redundancy.
- Multiple related tables: This can lead to a more complex schema with multiple related tables.
- Advantages:
- Data consistency: Normalization can improve data consistency and reduce the chances of update anomalies.
- Space efficiency: Snowflake schemas can be more space-efficient, especially when dealing with large datasets.
- Easier maintenance: Normalized data may be easier to maintain, especially when dealing with slowly changing dimensions (SCD).
- Considerations: Query complexity: Snowflake schemas can introduce additional complexity in query design due to the need to join multiple related tables.
In the context of dimension modeling, two common schema designs are used:
These schemas are specifically structured to support data warehousing and analytics.
The choice between star and snowflake schemas depends on various factors, including the organization's specific data needs, data update frequency, and performance requirements. In practice, many data warehousing solutions use a combination of both, adapting the schema design to suit different dimensions and business requirements within the same data warehouse.
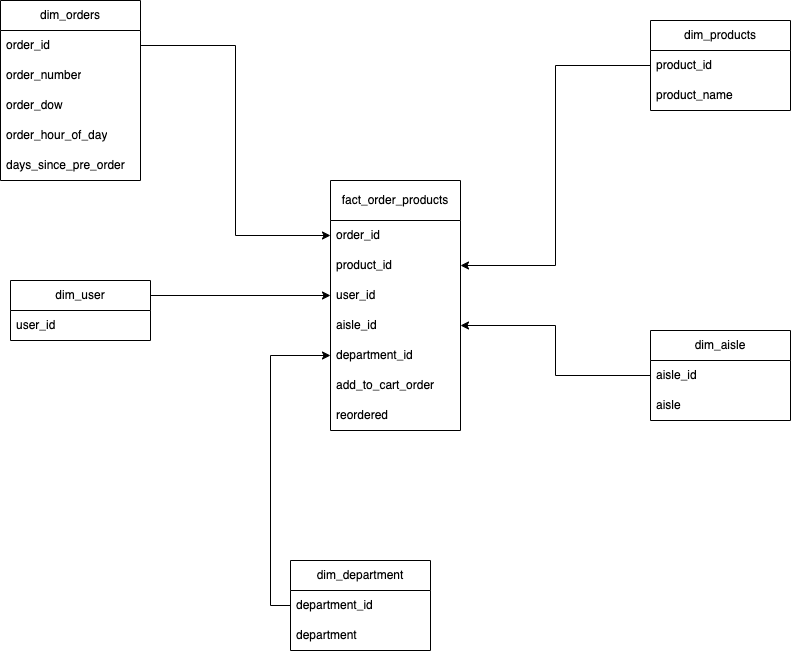
Example
Let's create a fact table for a fictional retail business to track sales data. We'll go through the steps of creating the fact table using this example:
- Step 1: Define the Business Process Our business process is to track and analyze sales data. We want to understand how much revenue we generate from the sales of various products in different stores over time.
- Step 2: Identify Dimensions Dimensions for our sales fact table include:
- Time (Date of the sale)
- Product (Product ID, Name, Category)
- Store (Store ID, Name, Location)
- Customer (Customer ID, Name)
- Step 3: Determine Grain We'll record sales data at the daily level, so our grain is daily sales.
- Step 4: Select Measures Measures we want to include in our fact table:
- Sales Amount (Revenue generated from each sale)
- Quantity Sold (Number of products sold in each transaction)
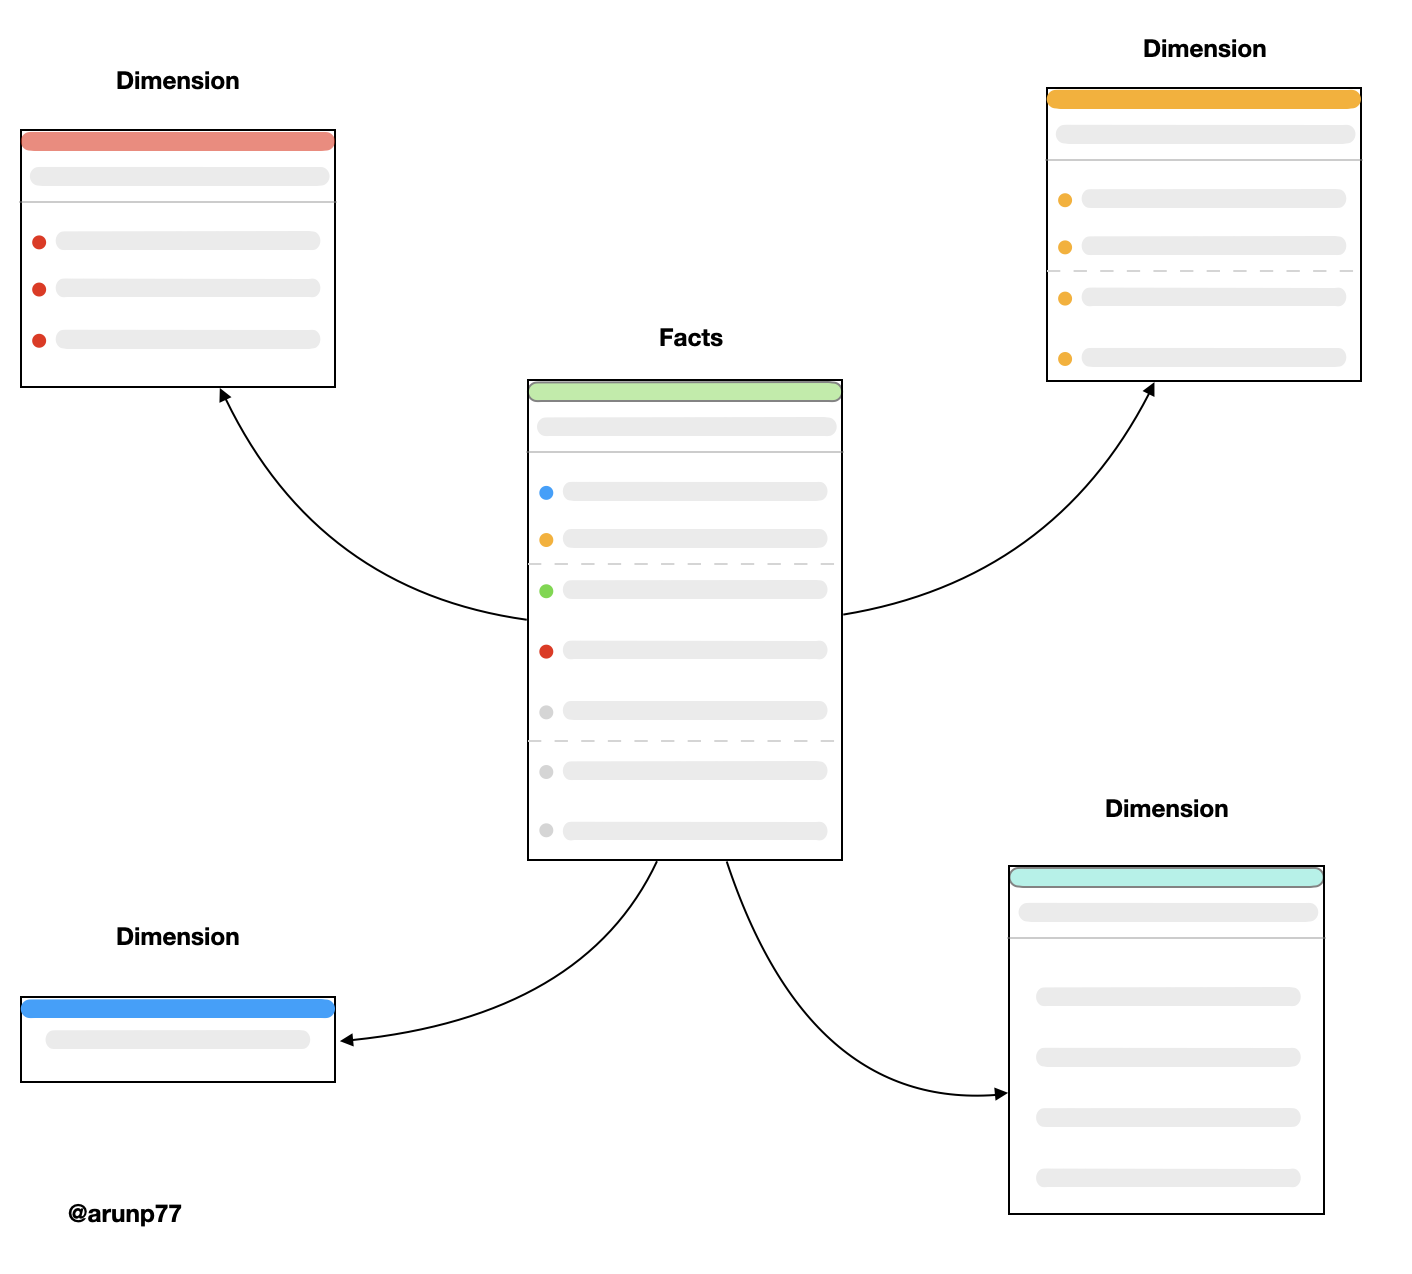
- Step 5: Design the Schema In this example, we'll use a star schema. The fact table will be at the center, surrounded by dimension tables (Time, Product, Store, Customer).
- Step 6: Create the Fact Table Our fact table, let's call it SALES_FACT, is created with the following columns:
- SaleID (Primary Key)
- DateKey (Foreign Key to Time Dimension)
- ProductKey (Foreign Key to Product Dimension)
- StoreKey (Foreign Key to Store Dimension)
- CustomerKey (Foreign Key to Customer Dimension)
- SalesAmount (Numeric)
- QuantitySold (Numeric)
Slowly Changing Dimensions (SCD)
- Slowly Changing Dimensions (SCD) is a crucial concept in dimension modeling, particularly in the context of data warehousing and business intelligence. SCD deals with how to handle changes to dimension attributes over time, ensuring that historical data remains accurate and available for analysis.
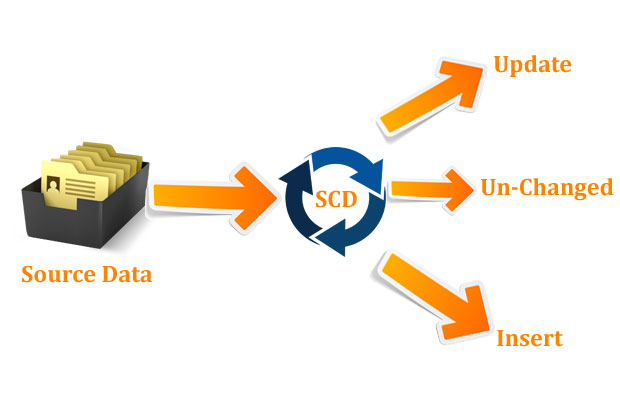
- This component is used if you want insert or update data records in dimension tables.
- Simplest explanation can be it compares incoming source data with existing destination dimension table data using a Business Key (Unique Key).
- If no record matches then it will treat as New Record or If record matches then it compares attributes for changed attributes if data looks updated then it updates record or if not then it leaves as it is unchanged.
Types of SCD
- Type 0: retain original: The Type 0 dimension attributes never change and are assigned to attributes that have durable values or are described as 'Original'. Examples: Date of Birth, Original Credit Score. Type 0 applies to most date dimension attributes
- Type 1: No History (Overwrite):
- In this approach, when a dimension attribute changes, the old value is simply overwritten with the new value.
- Historical data is not preserved, and the dimension reflects only the most recent state.
- This method is suitable when historical data is not important for analysis, or when storage efficiency is a primary concern.
- Example:
CustomerID Name City Email ... 1 Adam New York adam@example.com ... Lets suppose that Adam moves from New York to New Jersey.
CustomerID Name City Email ... 1 Adam New Jersey adam@example.com ... So we don't have any information about the previous city.
- Type 2: Add New Row (Historical):
- In the Type 2 SCD approach, when a dimension attribute changes, a new row is added to the dimension table to capture the new attribute value.
- This preserves the historical state of the dimension, allowing for historical analysis.
- Each row typically has an effective date range to indicate when it was valid.
- A surrogate key is often used to relate fact tables to the dimension tables.
- Type 2 is appropriate when historical data is important for analysis and reporting.
- Example: (Using a flag) In thia approach, we use a flag to indicate if a particular value is active or if it is current.
- Example: (using version numbers):
- Example: (using date ranges) In this approach, we use date ranges to show the period a particular record (row) was active:
SurrogateID CustomerID Name City Email isActive ... 1 1 Adam New York adam@example.com True ... A flag is added (isActive).
SurrogateID CustomerID Name City Email isActive ... 1 1 Adam New York adam@example.com False ... 2 1 Adam New Jersey adam@example.com False ... 3 1 Adam Miami adam@example.com True ... To get latest update on all customer, or a given customer, we just need to query isActive=True. Everytime there is a change, we need to add a new row and update the isActive column of the previous rows to False and newest to True.
SurrogateID CustomerID Name City Email Version ... 1 1 Adam New York adam@example.com 0 ... Here a version number is used.
SurrogateID CustomerID Name City Email Version ... 1 1 Adam New York adam@example.com 0 ... 2 1 Adam New Jersey adam@example.com 1 ... 3 1 Adam Miami adam@example.com 2 ... Here we need to filter on the max(Version) column to get the recent values.
SurrogateID CustomerID Name City Email StartDate EndDate ... 1 1 Adam New York adam@example.com 01-Jan-2020 NULL ... Here a version number is used.
SurrogateID CustomerID Name City Email StartDate EndDate ... 1 1 Adam New York adam@example.com 01-Jan-2020 25-Mar-2020 ... 2 1 Adam New Jersey adam@example.com 25-Mar-2020 01-Dec-2020 ... 3 1 Adam Miami adam@example.com 01-Dec-2020 NULL ... Example: (Using Flag and Date) In this approach, we use date ranges and Flag both to show the period a particular record (row) was active:
SurrogateID CustomerID Name City Email StartDate EndDate isActive ... 1 1 Adam New York adam@example.com 01-Jan-2020 25-Mar-2020 False ... 2 1 Adam New Jersey adam@example.com 25-Mar-2020 01-Dec-2020 False ... 3 1 Adam Miami adam@example.com 01-Dec-2020 NULL True ... - Type 3: Add Columns (Partial Historical):
- Type 3 SCD involves adding new columns to the dimension table to store a limited amount of historical data. Typically, two columns are added: one for the current value and one for the previous value.
- This approach allows for limited historical analysis by comparing the current and previous values.
- It's useful when full historical data is not needed, and there is a desire to keep historical changes in the same row.
CustomerID Name City PrevCity Email ... 1 Adam New Jersey New York adam@example.com ... So in this case, we only can retain infomration upto one step earlier.
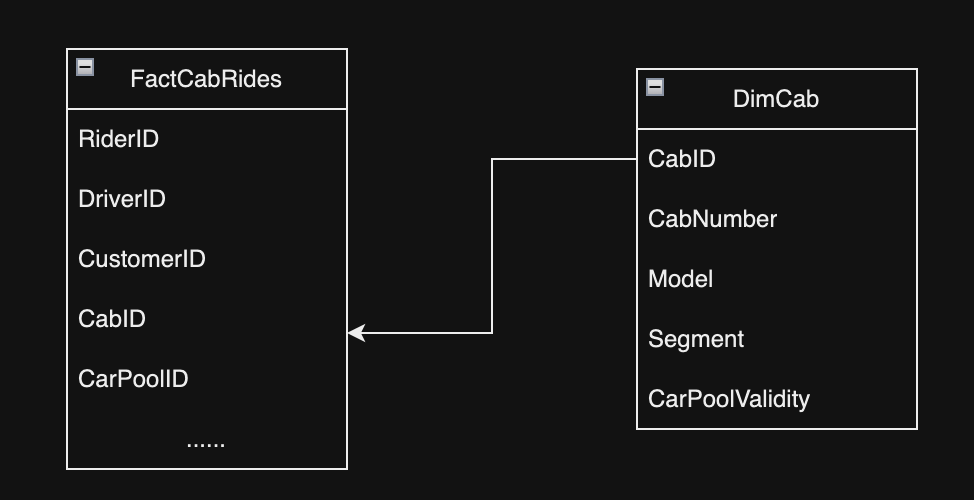
- Type 4: Hybrid Slowly Changing Dimension (SCD):
- Also known as "Type 4" or "SCD Type 4," this hybrid approach combines elements of both Type 2 and Type 1.
- In this method, a separate historical table is created to track changes over time while the main dimension table remains static.
- The historical table captures the history of changes, allowing for historical analysis.
- It can be more space-efficient compared to a pure Type 2 approach since the main dimension table remains relatively small.
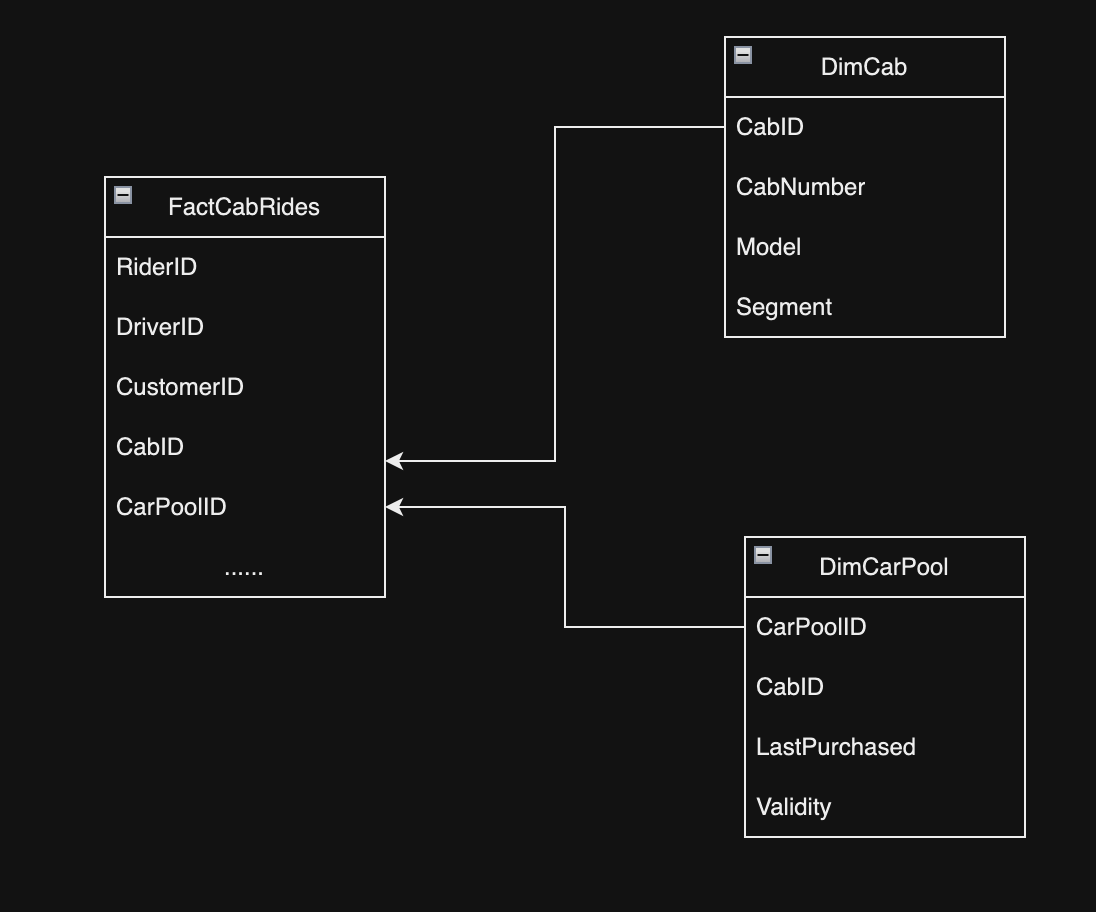
- Example: In the following diagram, if we assume that the carpool (also known as High occupancy vehicles) pass needs to be purchased everymonth, we can move that field to a smaller mini-dimesnion and reference it directly from the fact table
we can split the table into a mini DimCarPool Dimension.
- Type 6: Type 1 + Type 2 (Combination SCD):
- Type 6 SCD is a combination of Type 1 and Type 2 approaches.
- In this method, you maintain a current value in the main dimension table (Type 1) while also creating new rows for historical changes (Type 2).
- This provides both the most recent data and a history of changes, but it can be more complex to manage compared to other methods.
- Example:
SurrogateID CustomerID Name City PrevCity Email StartDate EndDate isActive ... 1 1 Adam Miami NULL adam@example.com 01-Jan-2020 25-Mar-2020 False ... 2 1 Adam New Jersey New York adam@example.com 25-Mar-2020 01-Dec-2020 False ... 3 1 Adam Miami New Jersey adam@example.com 01-Dec-2020 NULL True ...
Slowly Changing Dimensions summary
- The choice of which SCD type to use depends on the specific needs of your organization and the nature of the data you are working with. It's essential to consider factors like data update frequency, the importance of historical data, query performance, and data storage constraints when deciding on the appropriate SCD method for your dimension modeling. Type 1 and Type 2 are the most commonly used SCD types, but the others may be valuable in certain scenarios.
- Choosing the appropriate SCD method depends on the specific requirements of the organization and the nature of the data. Type 2 SCD is the most common choice for data warehousing and analytics, as it strikes a balance between historical preservation and simplicity. However, Type 1 and Type 3 can be useful in certain scenarios.
- SCD is essential because it ensures the accuracy of data in data warehousing and analytics environments, enabling organizations to analyze historical trends, track changes, and make informed decisions based on historical data. The choice of SCD method should align with the business needs and the dimension modeling strategy in place.
| SCD Type | Summary |
|---|---|
| Type 0 | Ignore any changes and audit the changes. |
| Type 1 | Overwrite the changes. |
| Type 2 | History will be added as a new row. |
| Type 3 | History will be added as a new column. |
| Type 4 | A new dimension will be added. |
| Type 6 | Combination of Type 2 and Type 3. |