
DataVista: Graphic User Interface
Objective
DataVista is a modern Tkinter application designed for complex data analytics, providing a user-friendly interface to visualize, manipulate, and analyze datasets.
For more details, please find the open source project details on: github repository (currently a private but very soon make it open source).
Features
- Modern UI design with customizable themes
- Reusable components for quick development
- Responsive layout adaptable to various screen sizes
Requirements
- Python 3.x
- Tkinter (included with standard Python installation)
Steps
- Clone the repository:
Next, go to the Tkinter project directory:git clone https://github.com/arunp77/datavista.gitcd datavista/ - Install Poetry if you haven't already. Follow the instructions on the Poetry website.
- Create a virtual environment and install dependencies:
- Create and activate a virtual environment:
#!/bin/bash $ python -m venv venv $ source venv/bin/activate # On linux $ venv\Scripts\activate # on windows - Install required packages:
or just installpoetry installtkinterusing (for more details on the tkinter library, please check the official documentation):pip install tk
- Create and activate a virtual environment:
- Docker image: The docker image of the complete application can be found at: datavista-application
Usage
To run the application, execute the following command in your terminal:
python src/main.pyor
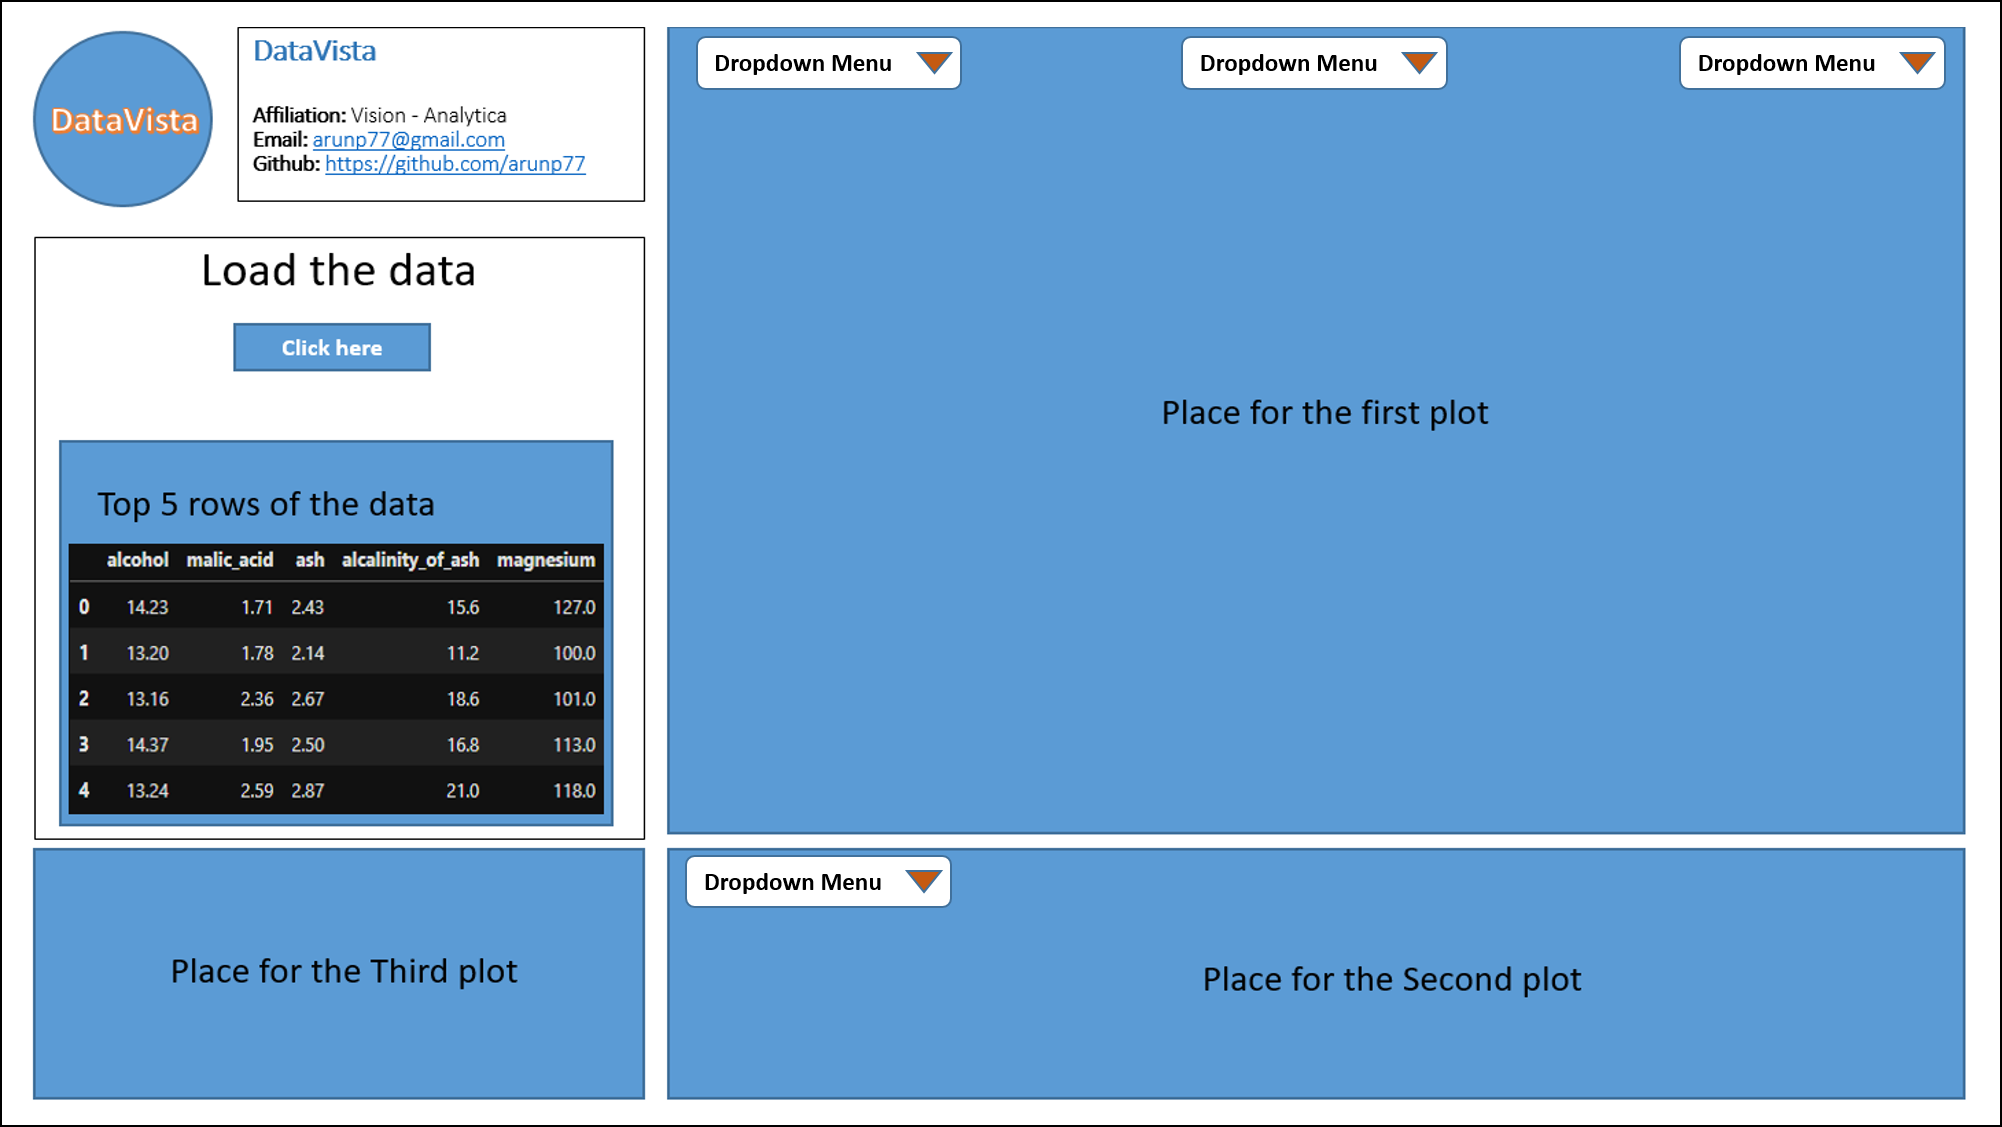
poetry run python src/main.pyThe Planned Interface
Our current plan is to create an interface with:
- Data load option
- View the first 5 lines after loading the data
- Create a few plots such as scatter, line, bar, etc.
Future Plan
I will be modifying the interface more in the future. I will try to make it look more advanced and enable more advanced-level data analytics, including machine learning analysis.
Project Structure
        datavista/
            ├── src/
            │   ├── __init__.py
            │   ├── main.py                     # Main application file
            │   └── ui/
            │       ├── main_window.py          # Main window class
            │       └── custom_widgets.py       # Custom widgets
            ├── tests/
            ├── pyproject.toml
            └── README.md
Contributing
Feel free to contribute to this project! Please follow these steps:
- Fork the repository.
- Create a new branch:
git checkout -b feature/your-feature - Commit your changes:
git commit -m "Add your new feature" - Push to the branch:
git push origin feature/your-feature - Open a pull request.
License
This project is licensed under the MIT License. See the LICENSE: Creative Commons Legal Code CC0 1.0 Universal file for details.
Contact
For any inquiries, feel free to reach out to arunp77@gmail.com.
Some other interesting things to know:
- Visit my website on For Data, Big Data, Data-modeling, Datawarehouse, SQL, cloud-compute.
- Visit my website on Data engineering