
Resolution and calibration
Analog and digital images
In remote sensing, it is very important to understand the data provided by sensors in order to interpret them properly. The first thing to do is to understand what a satellite image is and why it is different from a photograph. The main difference between a photograph and a satellite image is that the photograph has an analogue format and is usually printed on paper before being interpreted. The satellite image has a digital format and a computer is generally used to analyse and interpret it. The evolution of remote sensing techniques has witnessed a transition from traditional analog methods to the contemporary era of digital technology. A comparative table below summarizes key differences between the two.| Aspect | Analog Photographs | Digital Images |
|---|---|---|
| Capture Method | Uses film and optical systems for capturing images. | Employs electronic sensors to directly capture digital data. |
| Resolution | Limited resolution, typically lower than digital counterparts. | Higher resolution, enabling finer detail and clarity. |
| Flexibility | Limited post-capture manipulation options. | Allows extensive post-processing for enhancement and analysis. |
| Storage | Requires physical storage space for film rolls. | Data stored digitally, facilitating easy archiving and retrieval. |
| Transmission | Time-consuming and manual distribution of physical prints. | Easily transmitted electronically for rapid sharing and analysis. |
| Cost | Lower initial costs, but ongoing expenses for film and processing. | Higher initial investment, but lower ongoing costs for storage. |
| Environmental Impact | Chemical processes in film development can be environmentally harmful. | Generally more environmentally friendly, with less chemical waste. |
| Integration with Technology | Limited integration with modern data analysis tools. | Seamless integration with advanced data science and analytics tools. |
Digital image formats
- The distinction between analogue and digital formats lies in how they represent and store information. In the analogue format, data is continuous, seamlessly spread throughout. For instance, when you capture an image in an analogue format, there are no discernible edges between different parts of the image.
- On the other hand, digital format employs a different approach. It saves information in separate blocks, often referred to as pixels. When you zoom in on a digital image, you'll notice these pixels—small squares of various colors in the case of satellite imagery. This discrete representation, organized in a matrix of squares, is a key characteristic of digital formats.
- The digital format relies on a mathematical process called a 'binary system'. This system is the foundation of computer operations, enabling them to register, calculate, save data, and display
images. In the binary system, computers comprehend only electric pulses, translating them into a binary code of
0s and1s. This binary language forms the basis of the entire computer world. - Mathematicians initially doubted the ability of computers to handle decimal systems, the way we traditionally count (0 to 9, then a new series from 10 to 19, and so on). However, computers
operate in a binary mode, going from 0 to 1, restarting the series. It's a binary world where '
yes' or 'no,'0or1, encapsulates the fundamental language of computation - A group of 2 numbers (also called 'digits') is called a 'bit';
- A group of 8 bits is called a 'byte' (= 256 in the decimal system);
- 1 Kb is equal to 1000 bytes;
- 1 Mb is equal to 1,000,000 bytes;
- If your computer has a memory of 64Mb, this means that it can cope with data containing up to 64 × 1,000,000 × 8, that is 512,000,000 bits or electric pulses;
- And if your computer has a hard disk of 2Gb, it means that it can contain data amounting to 2 × 1,000,000,000 × 8, that is 16,000,000,000 bits or electric pulses.
Visual image interpretation
It implies the human’s ability to analyze the content of images, e.g., land cover and land use from remote sensing imagery. Visual image interpretation encompasses two steps:- first the perception of objects according to their external attributes and,
- second, the actual interpretation of their meaning.
| Attribute | Description (example) | Interpretation (example) |
|---|---|---|
| Contrast, color, brightness | Transition from light to dark blue | Variations in water depth |
| Geometry (shape, size) | Sinuous ribbon-like object | River |
| Texture (structure of a surface) | Rough surface with vertical line patterns | Maize cultivation |
| Spatial context (functional interrelationship) | Rail tracks that intersect a building | Railway station |
What is raster and vector data?
Raster data and vector data are two primary types of geospatial data representations used in geographic information systems (GIS) and related fields.Raster data is a type of geospatial data representation that is used to capture and store information about the characteristics of geographic phenomena. Unlike vector data, which represents spatial information using points, lines, and polygons, raster data is structured as a grid of cells, where each cell or pixel holds a specific value. These cells collectively form a grid, and each cell contains a value that represents a certain attribute or characteristic at that location. This attribute could be elevation, temperature, land cover, or any other measurable quantity.
- Raster Data: Raster data represents the Earth's surface as a grid of cells or pixels, with each cell containing a single value or multiple values representing a specific attribute. Examples of raster data include:
- Satellite imagery: Captures images of the Earth's surface, often divided into bands representing different wavelengths of light.
- Digital elevation models (DEMs): Represent elevation data as a grid, commonly used for terrain analysis and visualization.
- Land cover classification: Categorizes the Earth's surface into different land cover types (e.g., forests, water bodies) based on spectral characteristics.
Raster Data Formats: Raster data is typically stored in formats that are optimized for storing gridded or pixel-based data. Some common raster data formats include:
- GeoTIFF (.tif, .tiff): A widely used format for storing georeferenced raster data, including satellite imagery and elevation models.
- JPEG (.jpg, .jpeg): A compressed format commonly used for storing aerial and satellite imagery.
- NetCDF (.nc): A self-describing format commonly used for storing multidimensional scientific data, such as climate and atmospheric data.
- HDF (.hdf, .he5): Hierarchical Data Format, often used for storing remote sensing data and complex scientific data.
- ENVI (.img, .dat): A proprietary format used by the ENVI software for storing and processing remote sensing data.
- Vector data:
- Points: Represent specific locations on the Earth's surface, such as cities, landmarks, or GPS coordinates.
- Lines: Represent linear features such as roads, rivers, boundaries, and transportation networks.
- Polygons: Represent areas such as land parcels, administrative boundaries, and land use zones.
Vector data is typically stored in formats that are optimized for storing geometric objects, such as points, lines, and polygons. Some common vector data formats include:
- Shapefile (.shp, .shx, .dbf): A widely used format developed by Esri for storing geometric objects and associated attribute data.
- GeoJSON (.geojson): A format based on JSON for encoding geographic data structures, commonly used for web-based mapping applications.
- GML (Geography Markup Language): An XML-based format for encoding and transmitting geographic data.
- KML (.kml, .kmz): A file format used for displaying geographic data in web-based applications like Google Earth.
- DXF (.dxf): A format used for exchanging computer-aided design (CAD) data, often used for storing vector data in GIS applications.
While raster and vector data are the two primary formats, it's important to note that some types of geospatial information may not fit neatly into these categories. For example, LiDAR (Light Detection and Ranging) data, which captures three-dimensional point clouds of the Earth's surface, is often stored and analyzed as raster data (e.g., DEMs derived from LiDAR), but it can also be represented as point clouds or vector features. Similarly, some types of geospatial data, such as satellite imagery with vector overlays or thematic layers, may combine elements of both raster and vector data formats.
| Characteristic | Raster Data | Vector Data |
|---|---|---|
| Representation | Represented as a grid of regularly spaced cells or pixels. | Represents geographic features using points, lines, and polygons. |
| Structure | Each cell in the grid contains a specific value, representing a certain attribute or characteristic. | Points represent individual locations, lines represent linear features, and polygons represent areas. |
| Examples | Satellite imagery, digital elevation models (DEMs), aerial photographs, thermal images. | Road networks, political boundaries, lakes, buildings. |
| Characteristics | Well-suited for continuous and regularly varying data. Useful for representing imagery. | Well-suited for representing discrete features and the relationships between them. |
| Geometry | Uses a grid of cells. | Uses points, lines, and polygons. |
| Data Types | Suitable for continuous and regularly varying data. | Effective for discrete features and their relationships. |
| Storage | Can be more storage-intensive for certain types of information. | Generally less storage-intensive for the same information. |
| Analysis | Used for spatial analysis involving continuous data. | Used for analyzing discrete features and their attributes. |
Image format
An image format is a file format that is used to store digital images. The most common image formats regarding digital remote sensing imagery are illustrated in the table below:
| Format name | Extension | Description |
|---|---|---|
| GeoTIFF | .tif, .tiff, .gtiff | TIFF + geospatial reference |
| ENVI | .bsq, .bil, .bip, .dat | Generic, often used in the imaging spectroscopy community; Header file (.hdr) with metadata! |
| JPEG2000 | .jp2, .j2k | Used by many data providers; usually for integer values only |
| HDF4, HDF5 | .hdf, .h4, .hdf4, .h5, .hdf5 | Hierarchical data format, version 4 or 5; multi-resolution raster |
| netCDF | .nc | Network Common Data Format; multi-resolution raster |
| SAVE | Standard Archive Format for Europe, e.g., Sentinel-1 and Sentinel-2 |
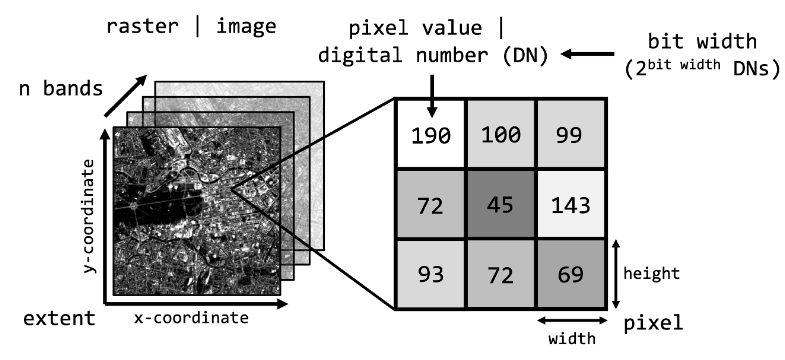
The pixels
In remote sensing, pixels are the smallest units of a digital image, representing specific areas on the Earth's surface. Each pixel has a numeric value reflecting the characteristics of the corresponding scene, such as brightness or color. Remote sensing images are composed of a grid of pixels, and the resolution is determined by the size of these pixels. Higher resolution provides more detailed images. Pixels are crucial for the digital representation, storage, and analysis of remote sensing data.
Each pixel holds a numeric value, known as a pixel value, reflecting attributes like color or brightness. In remote sensing, pixel values encode information about the observed scene, facilitating data interpretation and analysis. These values are fundamental for understanding and processing digital imagery.
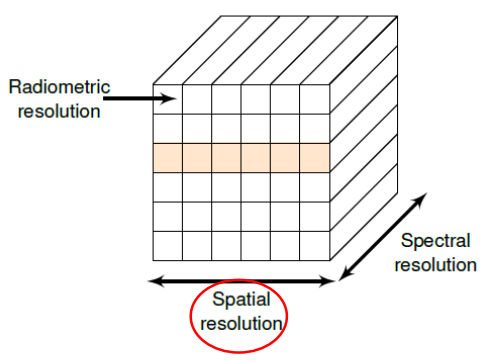
Resolution
The resolution of an image refers to the potential detail provided by the imagery. In remote sensing we refer to three types of resolution: spatial, spectral and temporal.
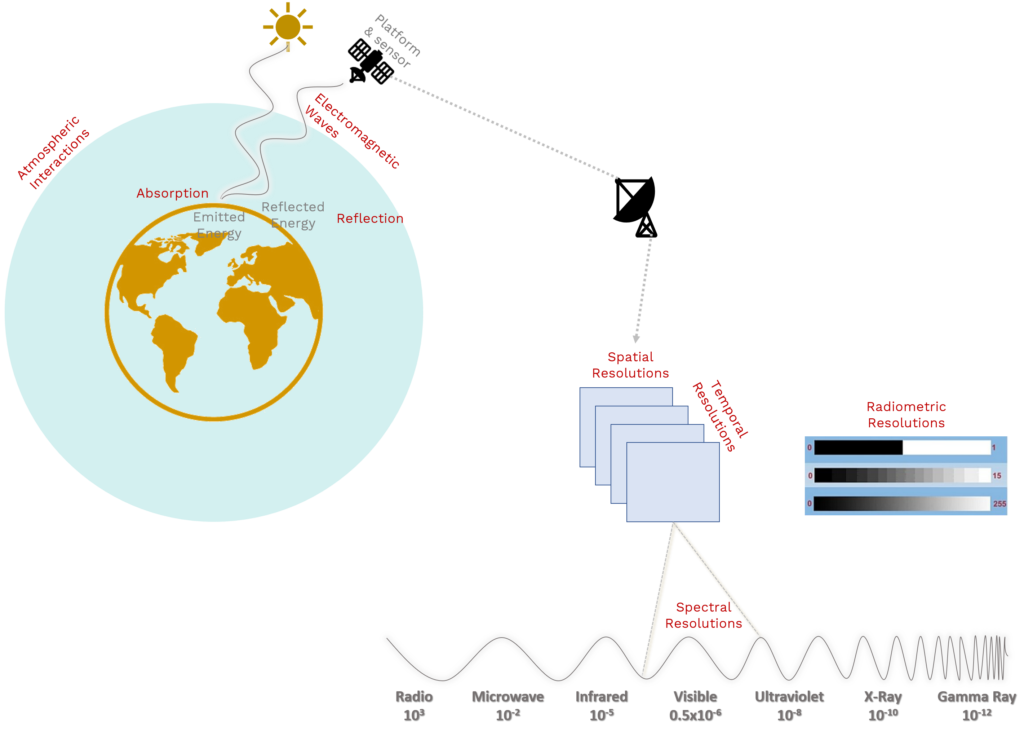
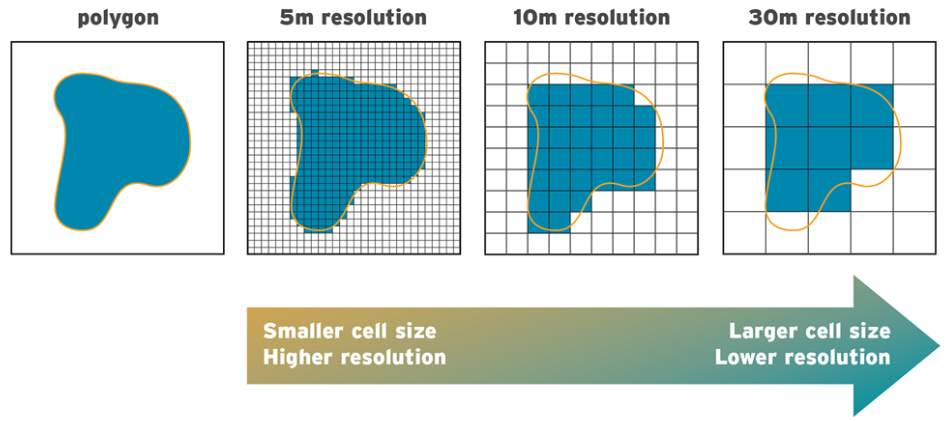
- Spatial Resolution: Spatial Resolution refers to the size of the smallest feature that can be detected by a satellite sensor or displayed in a satellite image. It is usually presented as a single value representing the length of one side of a square. For example, a spatial resolution of 250m means that one pixel represents an area 250 by 250 meters on the ground.
- Spectral Resolution: Spectral Resolution refers to the ability of a satellite sensor to measure specific wavlengths of the electromagnetic spectrum. The finer the spectral resolution, the narrower the wavelength range for a particular channel or band.
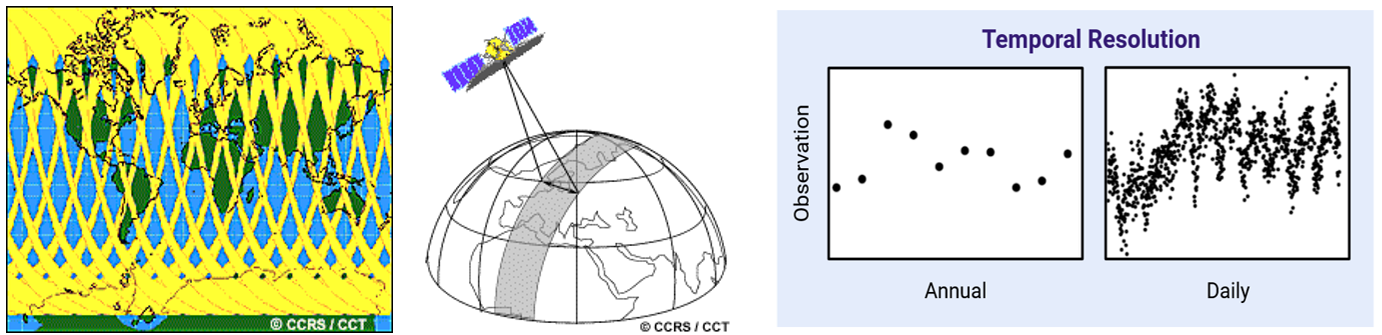
- Temporal resolution: Temporal resolution refers to the time between images. The capability for satellites to provide images of the same geographical area more frequently has increased dramatically since the dawn of the space age.
- Radiometric resolution: While the arrangement of pixels describes the spatial structure of an image, the radiometric characteristics describe the actual information content in an image. Every time an image is acquired on film or by a sensor, its sensitivity to the magnitude of the electromagnetic energy determines the radiometric resolution. The radiometric resolution of an imaging system describes its ability to discriminate very slight differences in energy The finer the radiometric resolution of a sensor, the more sensitive it is to detecting small differences in reflected or emitted energy.
1. Spatial Resolution, Pixel Size, and Scale
The spatial resolution describes above all the pixel size and/or the pixel distance (in the picture or at the object) and thus the ability of the sensor for detail differentiation. It depends on the type of sensor, the size of the CCD array (charge-coupled device) and the viewing angle.- For some remote sensing instruments, the distance between the target being imaged and the platform, plays a large role in determining the detail of information obtained and the total imaged by the sensor.
- Sensors onboard platforms far away from their targets, typically view a larger area, but cannot provide great detail. The detail discernible in an image is dependent on the spatial resolution of the sensor and refers to the size of the smallest possible feature that can be detected.
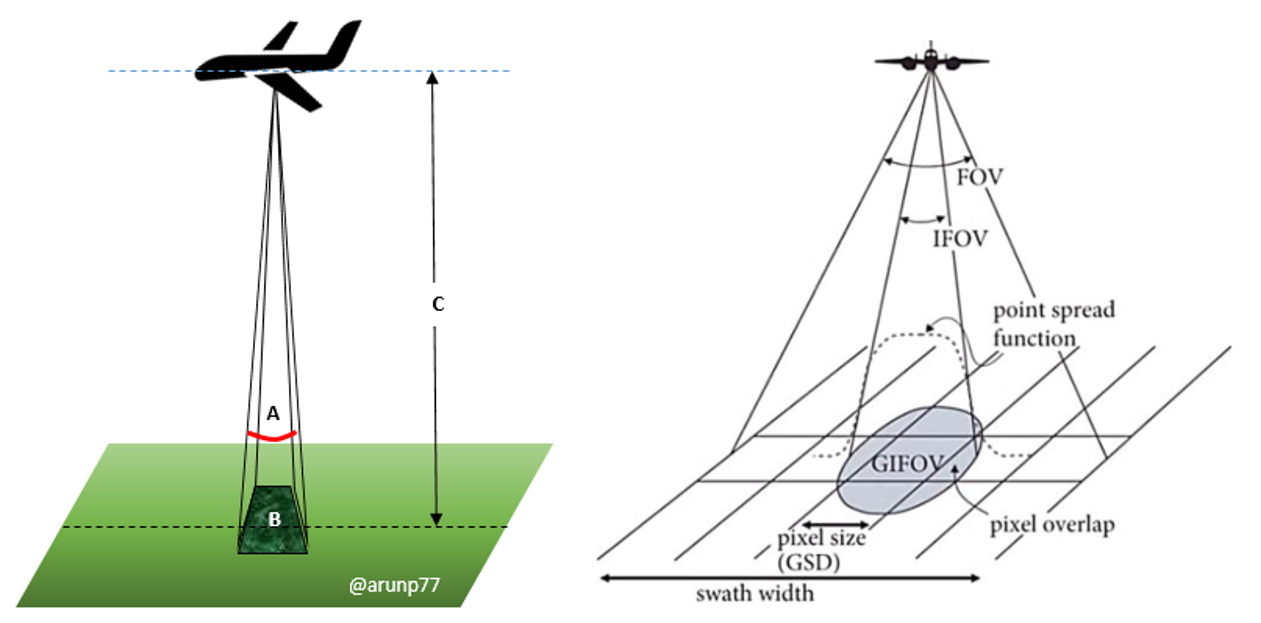
- Instantaneous Field of View (IFOV): Spatial resolution of passive sensors depends primarily on their IFOV.
- FOV = field of view, defines the swath width.
- IFOV = instantaneous field of view, defines the angle of the individual sensors.
- GIFOV = ground instantaneous field of view, is the IFOV projected onto the ground.
- GSD = ground sample distance (from GIFOV, detector size), defines the resulting pixel size
- Images where only large features are visible are said to have coarse or low resolution. In fine or high resolution images, small objects can be detected.
- The pixel size of the final image product thus depends on the sensor and fluctuates strongly between 0.4 and 900 m. For common free satellites they are 5 m (RapidEye), 30 m (Landsat 8) or 250/500 m (MODIS). Sentinel-2 has spatial resolutions of 10, 20 and 60 m depending on the channel. In addition to contrast, spatial image resolution is primarily decisive for the recognition and differentiation of objects.
2. Temporal resolution
In remote sensing, temporal resolution refers to the frequency or repeat cycle with which a sensor acquires data over the same location. It is typically expressed in days, weeks, or months, and it is an important factor in determining the suitability of remote sensing data for a particular application.
High temporal resolution data is useful for monitoring rapidly changing phenomena, such as wildfires, deforestation, and crop growth. It can also be used to create time-lapse animations that show how a landscape has changed over time.
Low temporal resolution data is more suitable for mapping large areas and for applications where changes occur slowly, such as land cover classification and geological mapping.
The temporal resolution of a remote sensor is determined by a number of factors, including:
- The orbit of the sensor: Satellites that orbit the Earth in polar orbits have a higher temporal resolution than satellites that orbit in geostationary orbits. This is because polar-orbiting satellites fly over the same location every few days, while geostationary satellites remain stationary over a fixed location
- The swath width of the sensor: The swath width is the width of the area that the sensor can image at once. Sensors with a wide swath width have a lower temporal resolution than sensors with a narrow swath width.
- The cloud cover: Clouds can obscure the Earth's surface, making it impossible for a sensor to acquire data. This can reduce the temporal resolution of the data.
Swaths:
The swath width refers to the coverage area on the Earth's surface captured by a satellite during a single pass. It is determined by the satellite's sensor characteristics and the satellite's altitude. A wider swath allows for broader coverage but may sacrifice image resolution.
Understanding the interplay between orbits and swaths is essential for optimizing satellite mission design. LEO satellites, for instance, may have smaller swaths but offer higher revisit frequencies, making them suitable for applications requiring frequent observations. GEO satellites, on the other hand, have a fixed view but cover a larger area with each pass, making them ideal for continuous monitoring.
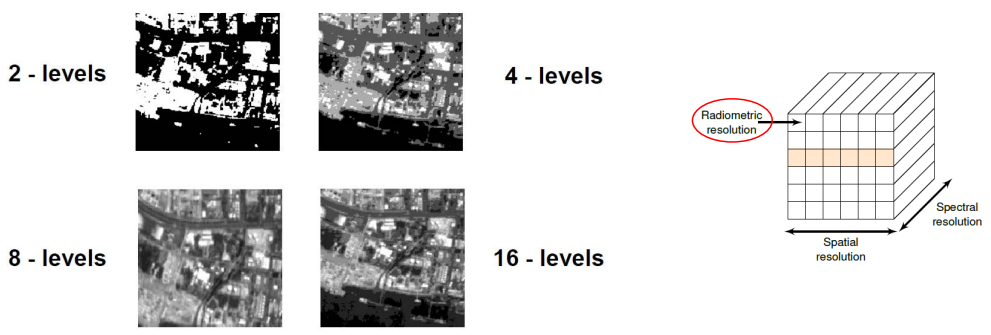
3. Radiometric resolution
The radiometric resolution indicates the ability of a sensor to distinguish between different intensities within the respective wavelength range of a channel. Simply speaking, it is the contrast of an image, indicating the number of grayscales - expressed in bits:- 1 bit = \(2^1\) = 2 gray levels
- 2 bit = \(2^2\) = 4 grey levels
- 4 bit = \(2^4\) = 16 grey levels
- 8 bit = \(2^8\) = 256 greyscales.
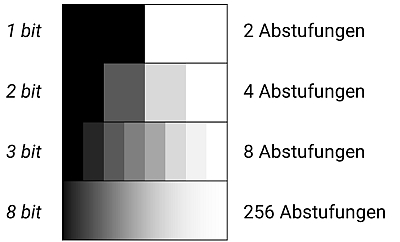
- Quantization Levels: It is often expressed in terms of the number of quantization levels or bits used to represent the intensity values. Higher radiometric resolution corresponds to a greater number of possible values.
- Sensitivity to Brightness Variations: A sensor with high radiometric resolution can capture subtle differences in brightness, allowing for more detailed and nuanced information about the objects or features in the scene.
- Dynamic range: The dynamic range of a sensor is closely related to radiometric resolution. A broader dynamic range enables the sensor to capture a wide range of intensities, from very dark to very bright
- Application: Radiometric resolution is crucial in applications where detecting small variations in reflectance or emitted radiation is essential. This includes tasks like land cover classification, mineral identification, and environmental monitoring.
- Trade offs: There can be trade-offs between radiometric and spatial resolution in remote sensing systems. Increasing radiometric resolution may require sacrificing spatial resolution and vice versa.
- Image quality: Radiometric resolution directly affects the image quality of a sensor. A higher radiometric resolution will produce a more detailed and accurate image.
- Image processing: Radiometric resolution can also affect the ability of image processing algorithms to extract information from images. For example, a higher radiometric resolution may be required to accurately identify objects in an image.
- Scientific applications: Radiometric resolution is also important in many scientific applications, such as remote sensing and astronomy. In these applications, the ability to distinguish between different levels of radiation can be critical for making accurate measurements.
- The type of sensor: Different types of sensors have different radiometric resolutions. For example, electronic cameras typically have higher radiometric resolutions than film cameras.
- The sensitivity of the sensor: The sensitivity of the sensor also affects the radiometric resolution. A more sensitive sensor can distinguish between smaller levels of radiation.
- The ADC (analog-to-digital converter): The ADC is responsible for converting the analog signal from the sensor into a digital signal that can be processed by the computer. The resolution of the ADC will determine the maximum radiometric resolution of the sensor.
4. Spectral Resolution
- Spectral resolution refers to a sensor's ability to distinguish between different wavelengths or bands of electromagnetic radiation in the electromagnetic spectrum. It is a crucial aspect of remote sensing systems, influencing the capacity to capture and analyze various features on the Earth's surface.
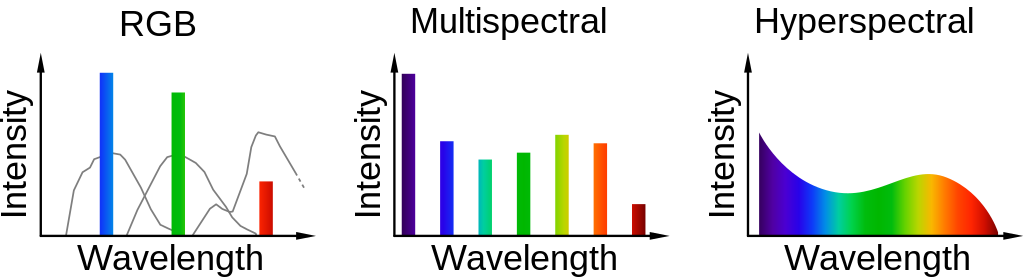
- Spectral resolution describes the amount of spectral detail in a band. High spectral resolution means its bands are more narrow. Whereas low spectral resolution has broader bands covering more of the spectrum.
- Wavelength Discrimination: Remote sensing sensors with higher spectral resolution can differentiate between a greater number of narrow bands across the electromagnetic spectrum. This discrimination allows for more detailed analysis of surface features.
- Bands and Channels: Spectral resolution is often associated with the number and width of bands or channels in a sensor. Multispectral sensors capture data in several broad bands, while hyperspectral sensors operate with numerous narrow and contiguous bands.
- Applications: Different surface materials and features interact with electromagnetic radiation in distinctive ways. Higher spectral resolution enables the identification and analysis of specific materials, vegetation types, and environmental conditions.
- Spectral Signatures: Each material exhibits a unique spectral signature, a distinctive pattern of reflectance or emission across different wavelengths. Fine spectral resolution facilitates the accurate identification of these signatures, contributing to more precise classification and interpretation.
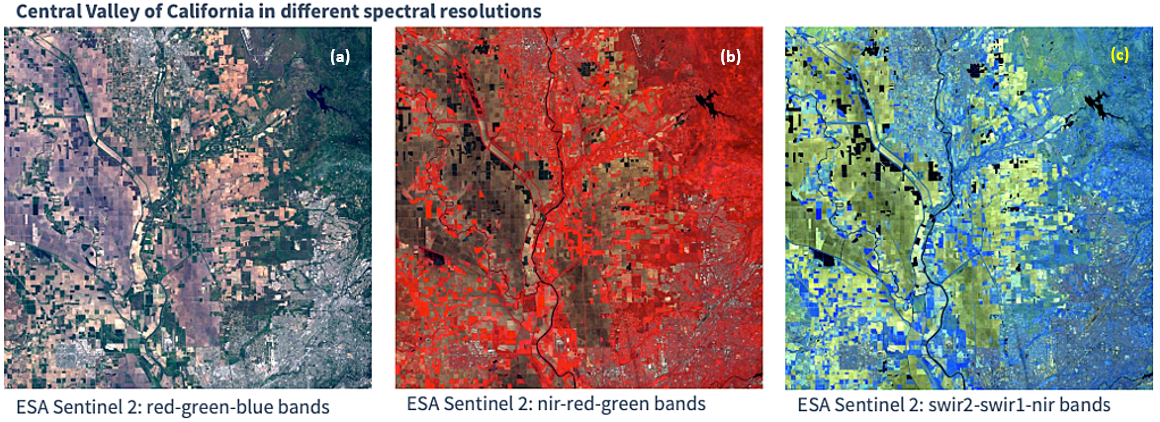
5. Multispectral Scanning
Multispectral remote sensing is a type of remote sensing that utilizes multiple bands of the electromagnetic spectrum to capture images of the Earth's surface. Unlike traditional single-band imaging, which captures information from a single wavelength range, multispectral scanning collects data from multiple bands, typically four to six, each sensitive to a specific portion of the electromagnetic spectrum. This multispectral approach provides a more comprehensive view of the Earth's surface, allowing for the identification and differentiation of various features that would be difficult to discern using single-band imagery.
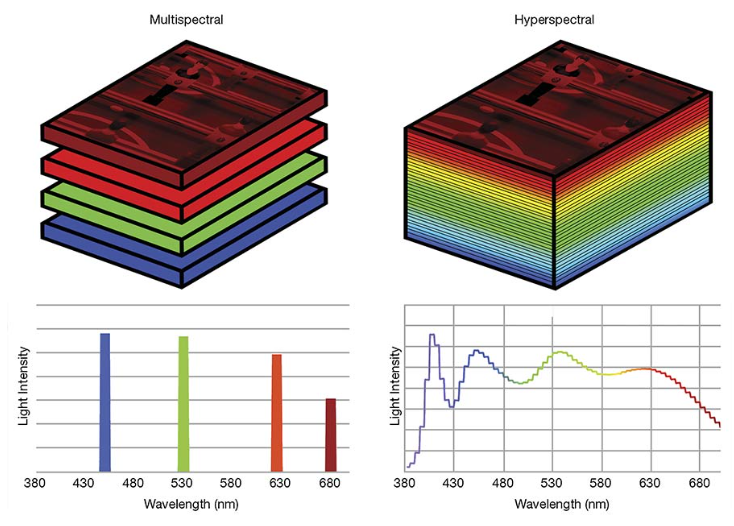
In spectral imaging, an object’s spectral information is parsed into multiple images, with each image resulting from a different wavelength band reflected or emitted from the object. The wavelength range of images can span from the ultraviolet to near-infrared (NIR) using standard silicon-based sensors, and into the NIR/shortwave infrared (SWIR) region using InGaAs (indium gallium arsenide) and other SWIR-compatible sensors. Images from each wavelength band are combined into a data matrix called an image cube. An image cube is essentially a stack of images in which each image in the stack corresponds to a discrete spectral band. The number of spectral bands in the cube differentiates hyperspectral from multi- spectral imaging. “Hyper” implies the accumulation of tens to hundreds of wavelength band images, and “multi” consists of more than one spectral band image
Benefits: Multispectral remote sensing offers several advantages over traditional single-band imaging:
- Enhanced Image Detail: By combining data from multiple spectral bands, multispectral images provide a more detailed and nuanced representation of the Earth's surface, revealing subtle variations in land cover, vegetation, and other features.
- Improved Land Cover Classification: Multispectral imagery is particularly useful in classifying different types of land cover, including forests, grasslands, urban areas, and water bodies. The ability to capture information across multiple wavelengths enables the identification of unique spectral signatures associated with different land cover types.
- Vegetation Analysis: Multispectral images are valuable tools for analyzing vegetation health, crop growth, and changes in plant cover. The near-infrared band, for instance, is sensitive to chlorophyll content, allowing for the assessment of plant productivity and stress.
- Water Resource Monitoring: Multispectral scanning can be used to detect and map water bodies, monitor water quality, and assess the extent of water stress or drought conditions. The near-infrared and red bands are particularly useful for discriminating between land and water features.
- Environmental Monitoring: Multispectral imagery plays a crucial role in environmental monitoring applications, including tracking deforestation, detecting wildfires, and assessing the impact of pollution on land and water resources. Multispectral data can provide valuable insights into the causes and consequences of environmental changes.
Applications Multispectral remote sensing has found applications in a wide range of fields, including:
- Agriculture: Multispectral images are used to monitor crop health, identify areas of stress or disease, and optimize irrigation practices. By analyzing spectral signatures, farmers can make informed decisions to improve crop yields and resource management.
- Forestry: Multispectral data is employed to assess forest health, track deforestation, and map forest types. Multispectral images can reveal subtle changes in forest cover, allowing for early detection of deforestation and monitoring of forest regeneration efforts.
- Geology: Multispectral scanning can aid in geological mapping, mineral exploration, and identification of landforms and soil types. Multispectral imagery can provide valuable insights into the geological composition of an area, assisting in mineral exploration and geological surveys.
- Urban Planning: Multispectral images can be used to map urban areas, analyze urban sprawl, and identify areas of potential development. Multispectral data can help urban planners assess land use patterns, identify suitable areas for development, and plan for sustainable urban growth.
- Disaster Management: Multispectral scanning plays a critical role in disaster management, including mapping floodplains, tracking wildfires, and assessing damage after natural disasters. Multispectral imagery can provide real-time information about the extent and impact of disasters, aiding in emergency response and recovery efforts.
Challenges of Multispectral Remote Sensing: Despite its numerous advantages, multispectral remote sensing faces certain challenges:
- Atmospheric Interference: Clouds, haze, and dust can obscure the Earth's surface, reducing the quality of multispectral images and limiting their usefulness in certain conditions. Atmospheric correction techniques are employed to minimize the impact of atmospheric interference, but they don't always fully compensate for these effects.
- Sensor Limitations: Different sensors have varying resolutions, spectral ranges, and sensitivity, which can affect their ability to capture certain details or distinguish between subtle spectral variations. Sensor calibration and data processing techniques are used to enhance image quality and reduce sensor-specific limitations.
- Data Processing and Analysis: Interpreting and extracting meaningful information from large volumes of multispectral data can be computationally demanding and require specialized expertise. Advanced image processing algorithms and machine learning techniques are being developed to automate and improve the analysis of multispectral data.
Future directions: Technological advancements in sensor technology, data processing algorithms, and artificial intelligence are driving the continuous evolution of multispectral remote sensing. Next-generation sensors will offer higher resolutions, broader spectral ranges, and improved sensitivity, providing even more detailed and accurate images of the Earth's surface. These advancements will further enhance the capabilities of multispectral scanning in addressing environmental challenges, supporting sustainable development, and enabling a deeper understanding of our planet's diverse landscapes.
Hyperspectral imaging
Hyperspectral imaging is a powerful remote sensing technique that captures highly detailed images of the Earth's surface by measuring electromagnetic radiation across a broad range of wavelengths. Unlike traditional imaging techniques that capture images in a few broad bands, hyperspectral imaging captures hundreds or even thousands of bands, providing a continuous spectrum of information. This rich spectral data allows for the identification and differentiation of a wide range of features with exquisite precision.
Types of hyperspectral imaging
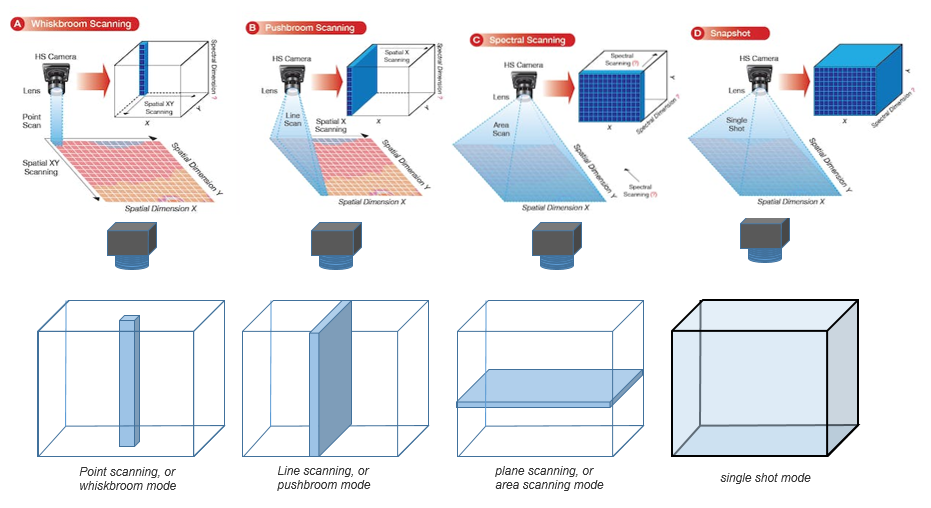
There are six main types of hyperspectral imaging:
- Whiskbroom Imaging: This type of hyperspectral imaging uses a two-dimensional array of detectors to capture images. The sensor is rotated across the scene, and each detector measures the radiation at a specific wavelength.
- Pushbroom Imaging: This is the most common type of hyperspectral imaging, and it uses a linear array of detectors to capture images. The sensor is scanned across the scene, and each detector measures the radiation at a specific wavelength.
- Snapshot Imaging: This type of hyperspectral imaging uses a staring array of detectors to capture images. The entire scene is imaged at once, and each detector measures the radiation at a specific wavelength.
- Line Scanning Imaging: This type of hyperspectral imaging uses a single detector to scan across the scene. The detector measures the radiation at all wavelengths at each point along the scan line.
- Tunable Filter Imaging: This type of hyperspectral imaging uses a tunable filter to select specific wavelengths of radiation. The filter is tuned to a particular wavelength, and the sensor captures an image at that wavelength. The process is repeated for all wavelengths of interest.
- Fourier Transform Spectroscopy (FTS): This type of hyperspectral imaging uses an interferometer to measure the spectrum of radiation at each point in the scene. The interferometer produces an interference pattern, which is then analyzed to extract the spectral information.
| Type | Description | Advantages | Disadvantages |
|---|---|---|---|
| Pushbroom | Scans a linear array of detectors across the scene | Simple, fast | Poor spatial resolution |
| Whiskbroom | Rotates a two-dimensional array of detectors across the scene | High spatial resolution | Complex, slow |
| Snapshot | Uses a staring array of detectors to capture the entire scene at once | High spatial resolution, fast | Expensive |
| Line scanning | Scans a single detector across the scene | Simple, fast | Poor spatial resolution |
| Tunable filter | Selects specific wavelengths of radiation with a tunable filter | Can capture images at specific wavelengths | Slow |
| FTS | Uses an interferometer to measure the spectrum of radiation at each point in the scene | High spectral resolution | Complex, slow |
References
- Analogue versus digital images.
- Hyperspectral Remote Sensing Image Subpixel Target Detection Based on Supervised Metric Learning.
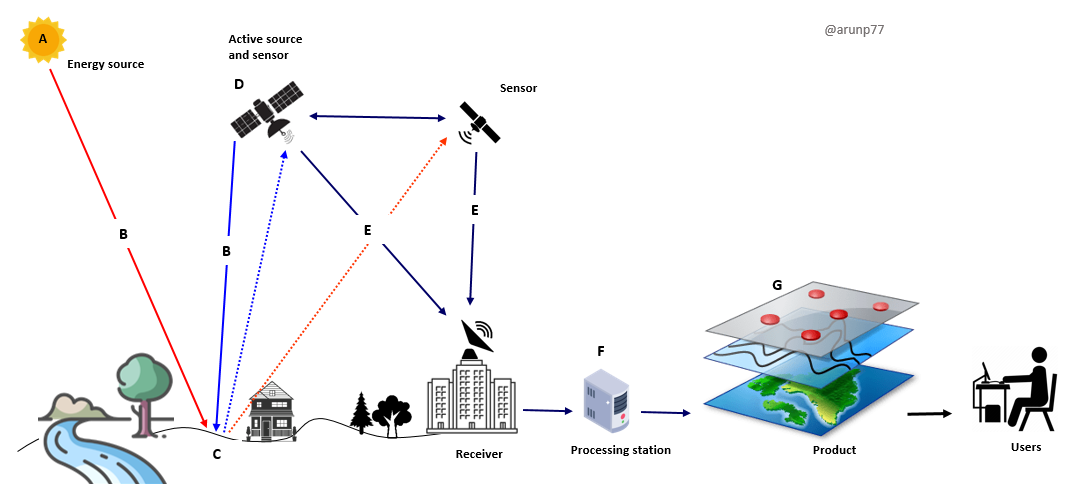
- Educational Series (part one): A Look into the Fundamentals of Remote Sensing
- Hyperspectral Imaging: A Review on UAV-Based Sensors, Data Processing and Applications for Agriculture and Forestry
- Data calibration and uncertainty.