
🧠 ANOVA (Analysis of Variance)
Introduction
ANOVA is a statistical method used to **compare the means of three or more groups** to determine if at least one group mean differs significantly from the others.
It extends the t-test (which compares two means) to multiple groups while controlling the Type I error rate.
🔹 Intuitive Idea
Instead of comparing means pairwise (like multiple t-tests), ANOVA compares variability between groups to variability within groups.
If the between-group variability is much larger than the within-group variability, it suggests that the group means are not all equal.
🔹 Hypotheses
$$ H_0: \mu_1 = \mu_2 = \mu_3 = \dots = \mu_k \quad \text{(all group means are equal)} $$ $$ H_a: \text{At least one group mean is different} $$🔹 The ANOVA Concept
ANOVA divides the **total variation** in the data into two components:
| Source of Variation | Description | Measured by |
|---|---|---|
| Between Groups | Differences due to group means | $$SS_{\text{between}}$$ |
| Within Groups (Error) | Random differences within each group | $$SS_{\text{within}}$$ |
🔹 The F-statistic
The F-statistic measures the ratio of between-group variance to within-group variance:
$$ F = \frac{MS_{between}}{MS_{within}} $$ where: $$ MS_{between} = \frac{SS_{between}}{df_{between}} \quad \text{and} \quad MS_{within} = \frac{SS_{within}}{df_{within}} $$- \(SS\): Sum of squares
- \(df\): Degrees of freedom
- \(MS\): Mean square (average sum of squares)
If \(F\) is large, it indicates that group means differ more than expected by random chance.
🔹 One-Way ANOVA
Purpose: Compare the means of three or more groups based on one independent variable (factor).
Example: You test whether three fertilizers produce different average plant growth.
| Group | Mean Growth (cm) |
|---|---|
| Fertilizer A | 12 |
| Fertilizer B | 15 |
| Fertilizer C | 18 |
Model:
$$ Y_{ij} = \mu + \tau_i + \varepsilon_{ij} $$where:
- \(Y_{ij}\): observation \(j\) in group \(i\)
- \(\mu\): overall mean
- \(\tau_i\): effect of group \(i\)
- \(\varepsilon_{ij}\): random error term (assumed normally distributed)
Assumptions:
- Independence of observations
- Normal distribution within each group
- Homogeneity of variances (equal variances across groups)
Decision Rule:
- Compute the F-statistic
- Compare it with the critical F-value from the F-distribution at a given significance level (e.g., α = 0.05)
- If F > Fcritical, reject H0
Post-hoc Tests (if H0 is rejected)
If you find a significant difference, use post-hoc tests such as Tukey’s HSD or Bonferroni to identify which groups differ.
Two-Way ANOVA
Purpose
Two-way ANOVA is used to compare means across groups when you have two independent variables (factors). It also allows testing for interaction effects between the factors.
Example
You test how fertilizer type (A, B, C) and sunlight exposure (Low, High) affect plant growth.
Model
where:
- μ: overall mean
- αi: effect of Factor A (e.g., fertilizer)
- βj: effect of Factor B (e.g., sunlight)
- (αβ)ij: interaction effect between A and B
- ϵijk: random error term
Hypotheses
-
For Factor A:
$$ H_0: \alpha_1 = \alpha_2 = \cdots = 0 $$ -
For Factor B:
$$ H_0: \beta_1 = \beta_2 = \cdots = 0 $$ -
For Interaction (A × B):
$$ H_0: (\alpha\beta)_{ij} = 0 $$
If the interaction is significant, it should be interpreted before examining the main effects.
Outputs
Two-way ANOVA produces three F-statistics:
- Effect of Factor A
- Effect of Factor B
- Effect of the interaction term (A × B)
Interpreting Results
| Term | Interpretation |
|---|---|
| F-statistic | Ratio of between-group variance to within-group variance |
| p-value | Probability of observing F by chance under H0 |
| Significant p (< α) | Reject H0 — at least one group differs |
| Post-hoc tests | Identify which specific groups differ |
Summary
| Type | Factors | Example | Main Goal |
|---|---|---|---|
| One-Way ANOVA | 1 | Compare test scores across 3 teaching methods | Does the method affect performance? |
| Two-Way ANOVA | 2 | Compare scores across teaching methods and gender | Does method, gender, or their interaction affect scores? |
In Short
- ANOVA tests whether group means differ significantly.
- The F-ratio compares between-group and within-group variation.
- One-way ANOVA → one factor; Two-way ANOVA → two factors (with interaction).
- Post-hoc tests help identify which groups differ.
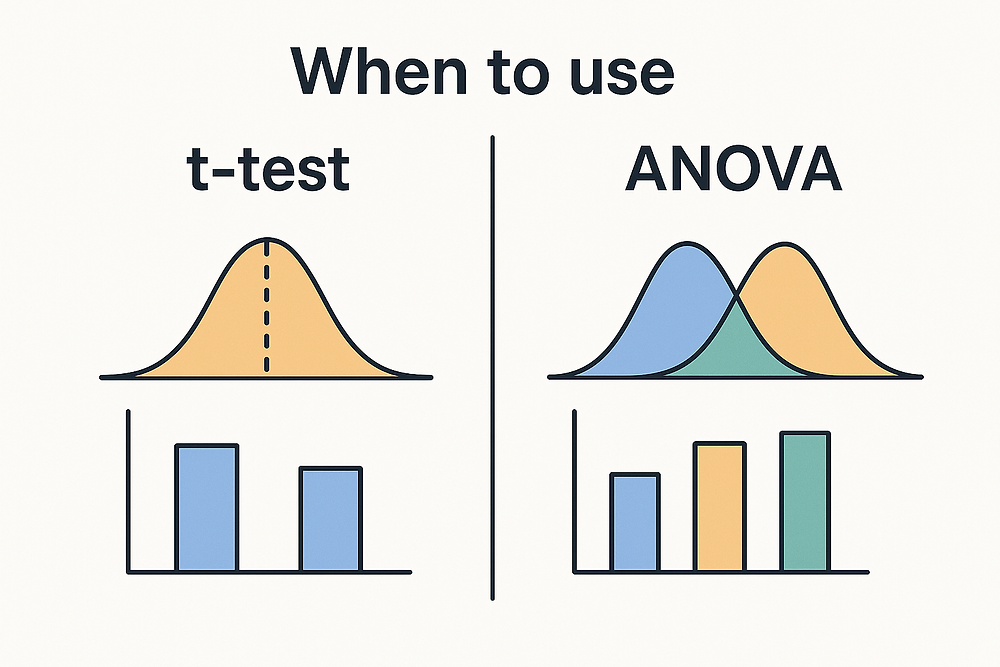
When to use t-test vs ANOVA: Choosing the Right Statistical Test
When comparing group means, one of the most common questions in statistics is whether to use a t-test or ANOVA. Both are hypothesis testing methods, but they are designed for different situations. Choosing the correct test is essential to avoid incorrect conclusions.The most important difference between a t-test vs ANOVA is the number of groups you're comparing:
- T-Test: Use when comparing the means of two groups.
- ANOVA: Use when comparing the means of three or more groups.
Key Differences at a Glance
| Feature | t-test | ANOVA |
|---|---|---|
| Number of groups | 2 | 3 or more |
| Main purpose | Compare two means | Compare multiple means |
| Output | t-statistic, p-value | F-statistic, p-value |
| Type I error risk | Low (for 2 groups) | Controlled across many groups |
| Post-hoc tests needed? | No | Yes (if significant) |
hy Not Use Multiple t-Tests Instead of ANOVA?
Using multiple t-tests increases the Type I error rate (false positives).Example:
- Testing 3 groups using pairwise t-tests requires 3 comparisons.
- Each test at α = 0.05 increases the chance of false significance.
- ANOVA controls this by testing all groups simultaneously.
Decision Guide (Quick Rule)
| Situation | Recommended Test |
|---|---|
| One group vs known value | One-sample t-test |
| Two independent groups | Independent t-test |
| Same group measured twice | Paired t-test |
| Three or more groups | One-way ANOVA |
| Multiple factors | Two-way ANOVA |
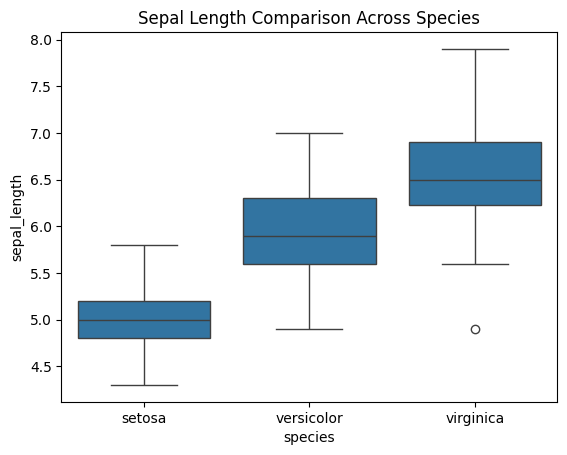
Example: Sepal length of Iris species
                import seaborn as sns
                import matplotlib.pyplot as plt
                from scipy.stats import ttest_ind, f_oneway

                # Load dataset
                iris = sns.load_dataset("iris")

                # Split groups
                setosa = iris[iris["species"] == "setosa"]["sepal_length"]
                versicolor = iris[iris["species"] == "versicolor"]["sepal_length"]
                virginica = iris[iris["species"] == "virginica"]["sepal_length"]

                # ----- T-TEST -----
                t_stat, p_val = ttest_ind(setosa, versicolor)
                print("T-test (Setosa vs Versicolor)")
                print("t =", t_stat, "p =", p_val)

                # ----- ANOVA -----
                f_stat, p_val_anova = f_oneway(setosa, versicolor, virginica)
                print("\nANOVA Result")
                print("F =", f_stat, "p =", p_val_anova)
Code output:
                T-test (Setosa vs Versicolor)
                t = -10.52098626754911 p = 8.985235037487079e-18

                ANOVA Result
                F = 119.26450218450468 p = 1.6696691907693826e-31
                import seaborn as sns
                import matplotlib.pyplot as plt

                sns.boxplot(x="species", y="sepal_length", data=iris)
                plt.title("Sepal Length Comparison Across Species")
                plt.show()
References
- Convolutional Neural Network Tutorial
- Datacamp tutorial.
- Analyticsvidhya tutorials.
- Getting started with Keras, Tensorflow and Deep Learning.
- Introduction to Deep Learning
- What is deep learning?
- Deep learning architectures
- Hands on Machine Learning with Scikit-Learn, Keras, & TensorFlow, Aurelien Geron
Some other interesting things to know:
- Visit my website on For Data, Big Data, Data-modeling, Datawarehouse, SQL, cloud-compute.
- Visit my website on Data engineering