
Statistics
Statistics deals with collecting, organizing, analyzing, interpreting, and presenting data to support decision-making and understand patterns or relationships.
In real life, we often cannot study an entire population. Statistics allows us to learn about large groups using limited data in a scientific and reliable way.
Broad Categories of Statistics
-
Descriptive Statistics
Definition: Descriptive statistics summarize and describe the main features of a dataset.
It answers the question: “What does the data look like?”
Descriptive statistics does not make predictions. It only helps us organize and present data clearly so patterns and trends are easy to see.
- Measures of Central Tendency: Mean, Median, Mode
- Measures of Dispersion: Range, Variance, Standard Deviation
- Measures of Shape: Skewness, Kurtosis
Graphical Methods to understand these parameters: Histograms, Pie Charts, Box Plots, Bar Charts, Scatter Plots
-
Inferential Statistics
Inferential statistics goes one step further. It uses sample data to make conclusions or predictions about a population.
Definition: Inferential statistics make predictions, decisions, or generalizations about a population based on sample data.
It answers the question: “What can we say about the population based on the sample?”
Key ideas include:
- Population vs Sample
- Sampling Techniques (Random, Stratified, Cluster, Systematic)
- Estimation (Point and Interval)
- Hypothesis Testing
- Confidence Intervals
- p-values and Significance Levels
- Type I and Type II Errors
Inferential statistics helps us deal with uncertainty and supports decision-making when complete data is not available.
Descriptive versus inferential statistics
| Descriptive Statistics | Inferential Statistics |
|---|---|
| Describes sample data | Makes inferences about population based on sample data |
| Provides summary measures such as mean, median, mode, standard deviation, etc. | Uses sample statistics to estimate population parameters |
| Helps in data exploration and visualization | Tests hypotheses about population parameters |
| Useful in describing and summarizing data | Helps in making predictions about future observations or outcomes |
| Examples: frequency distributions, measures of central tendency, measures of dispersion, etc. | Examples: t-tests, ANOVA, regression analysis, etc. |
Population vs Sample
- A population is the entire group you want to draw conclusions about.
- A sample is a subset of the population used for analysis.
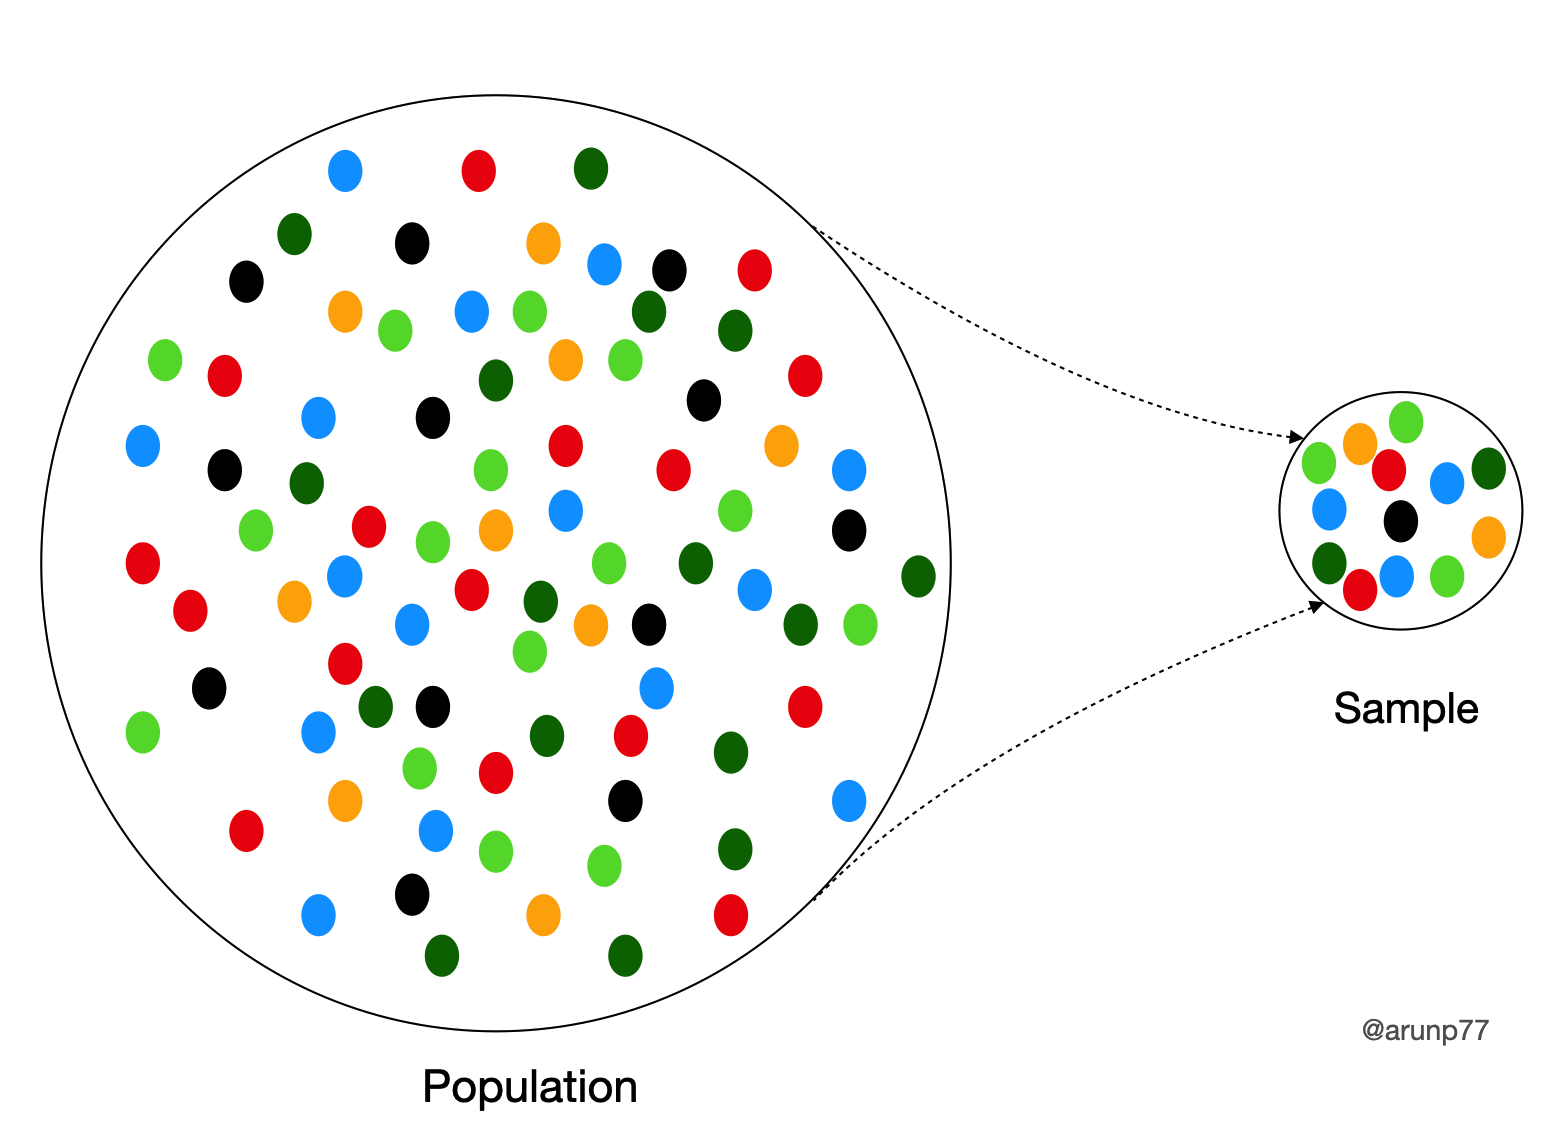
Example: Studying the average height of all adults in a country. The population is all adults; the sample is a randomly selected subset.
Difference between Population and Sample
| Population | Sample | |
|---|---|---|
| Definition: | Entire group of interest | Subset of the population |
| Size: | Very large or infinite | Smaller than population |
| Selection: | All members included | Selected members |
| Characteristics: | Exact parameters | Statistics estimate parameters |
| Example: | All dogs in a city | 100 randomly selected dogs |
If you want to move directly into descriptive statistics:
Go to Descriptive Statistics →Sampling Methods
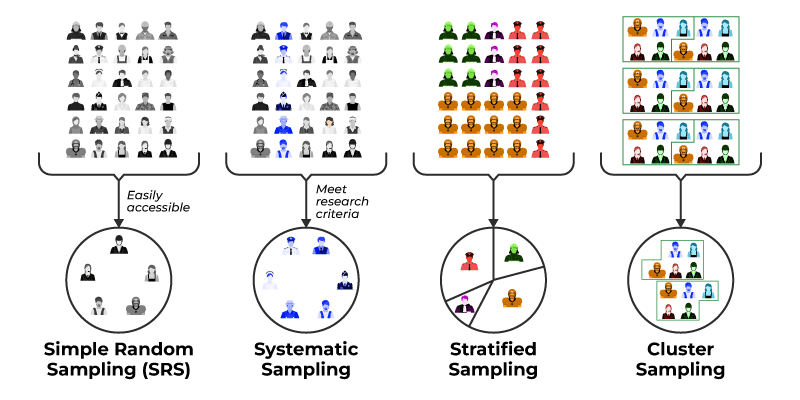
I. Probability Sampling Methods
Sampling methods refer to the techniques used to select a subset of individuals or units from a population to gather information. Here are some common sampling methods:
-
Simple Random Sampling
In this method, each individual in the population has an equal chance of being selected for the sample. This can be done using a random number generator or by using a table of random numbers.
Example: A researcher selects 100 students from a university's list of registered students by using a random number generator to pick the names.
-
Stratified Sampling
This method involves dividing the population into subgroups or strata based on a characteristic of interest (such as age or income level) and then selecting a random sample from each stratum. This ensures that the sample is representative of the population with respect to the characteristic of interest.
Example:A pollster divides the population of a city into age groups and then selects a random sample of 50 individuals from each age group.
-
Cluster Sampling
In this method, the population is divided into clusters or groups, and then a random sample of clusters is selected. All individuals in the selected clusters are included in the sample. This method is often used when it is difficult or costly to obtain a complete list of all individuals in the population.
Example: A public health researcher selects a random sample of 10 clinics from a list of all clinics in a particular region, and then collects data from all patients who visit those clinics during a certain period.
-
Systematic Sampling
This method involves selecting every nth individual from a list of the population. For example, if we want to select a sample of 100 individuals from a population of 1000, we would select every 10th individual from the list.
Example: A survey researcher selects every 5th customer who enters a store during a particular hour to ask them about their shopping experience.
-
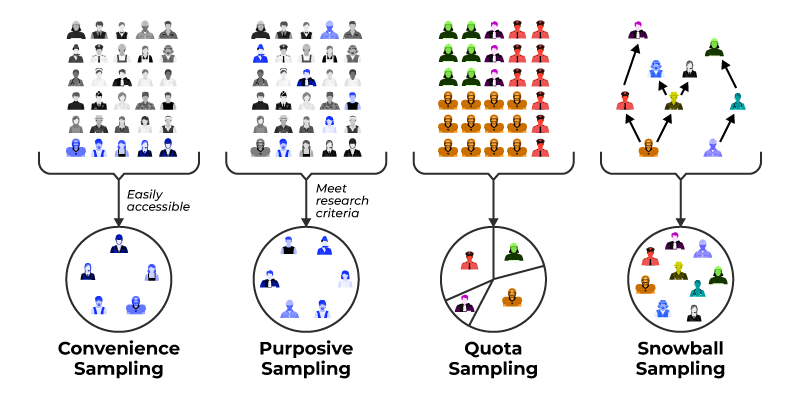
Convenience Sampling
This method involves selecting individuals who are readily available or easy to reach, such as using participants who are nearby or who respond to an online survey. However, this method may introduce bias as the sample may not be representative of the population.
Example: A college student hands out surveys to their classmates who are available in the classroom.
-
Snowball Sampling
This method is often used when the population is difficult to reach or identify. It involves selecting individuals who meet certain criteria and then asking them to identify others who also meet those criteria, and so on. This method can be useful for studying rare or hard-to-reach populations.
Example: A researcher studies the social networks of drug users by selecting a few initial individuals and asking them to identify other drug users they know, and so on.
II. Non-Probability Sampling Methods
Non-probability sampling methods are techniques for selecting a sample from a population in a non-random way. This means that every member of the population does not have an equal chance of being included in the sample. Non-probability sampling methods are generally used when it is difficult or impractical to obtain a random sample, such as when the population is small, hard to define, or not easily accessible. Here are some common non-probability sampling methods:
-
Convenience Sampling
This method involves selecting individuals who are readily available or easy to reach, such as using participants who are nearby or who respond to an online survey. However, this method may introduce bias as the sample may not be representative of the population.
Example: A researcher conducts a survey on campus by handing out questionnaires to students who happen to be walking by.
-
Quota Sampling
This method involves selecting a sample that matches certain characteristics of the population, such as age, gender, or ethnicity. The sample is selected until a predetermined number of individuals in each category are included.
Example: A market research firm wants to survey 100 individuals about a new product. They decide to include 50 men and 50 women in the sample.
-
Purposive Sampling
This method involves selecting individuals who are believed to be typical of the population or who have specific characteristics that are of interest to the researcher.
Example: A researcher studying eating habits selects a sample of individuals who are known to be vegetarian.
-
Snowball Sampling
This method is often used when the population is difficult to reach or identify. It involves selecting individuals who meet certain criteria and then asking them to identify others who also meet those criteria, and so on. This method can be useful for studying rare or hard-to-reach populations.
Example: A researcher studying a particular subculture selects a few initial individuals and asks them to identify other members of the subculture they know, and so on.
-
Judgmental Sampling
This method involves selecting individuals based on the researcher's judgment and expertise about the population.
Example: A political pollster selects a sample of individuals who are likely to vote for a particular candidate based on their knowledge of the political climate.
Non-probability sampling is useful when random sampling is impractical, but it may introduce bias and limit generalization.
Reference:
- Visit the "Learn about PostgreSQL"
- Visit the "DBMS Tutorials page"
- Visit my "Github repository on SQL" to learn about basics and some example projects.
- Visit my "Github repository" to learn about databases.